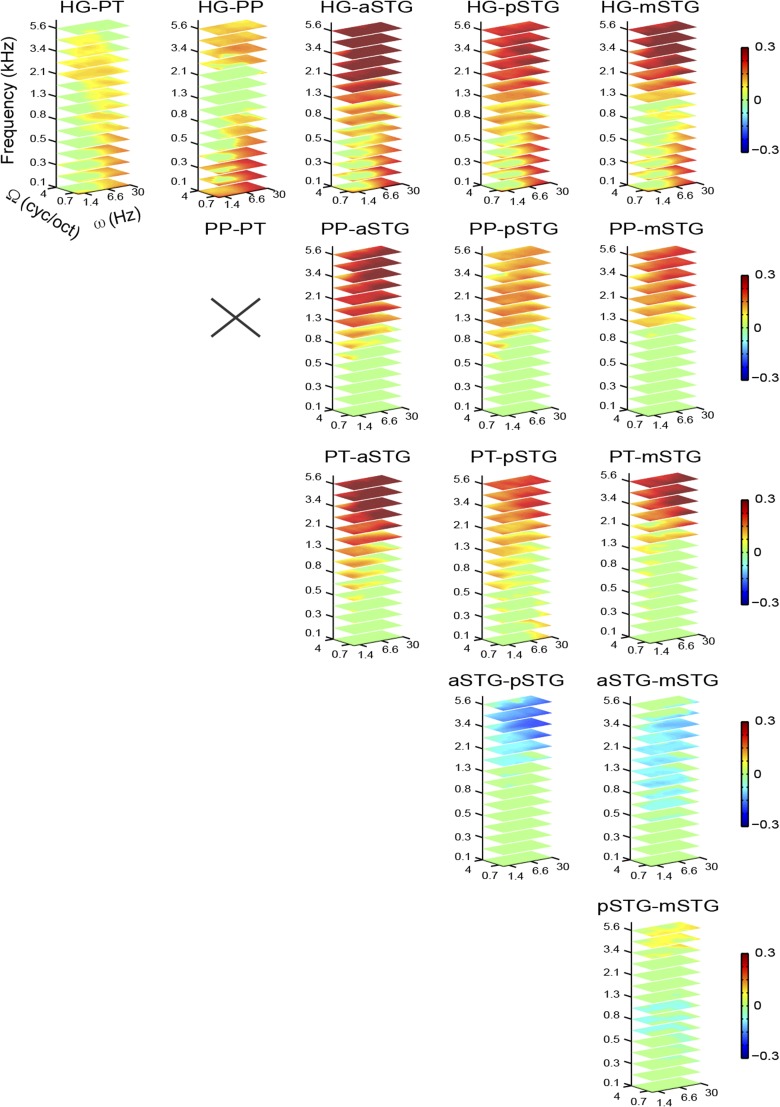
Fig. S3.
Pairwise comparisons between ROI-based MTFs. In each panel, the color code indicates the group-averaged difference between the MTFs of two ROIs. Features with a nonsignificant difference are assigned a value of 0 and depicted in green. A cross indicates pairs of MTFs that are not significantly different. MTFs have been interpolated for display purposes. Ω, spectral modulation scale; ω, temporal modulation rate.

