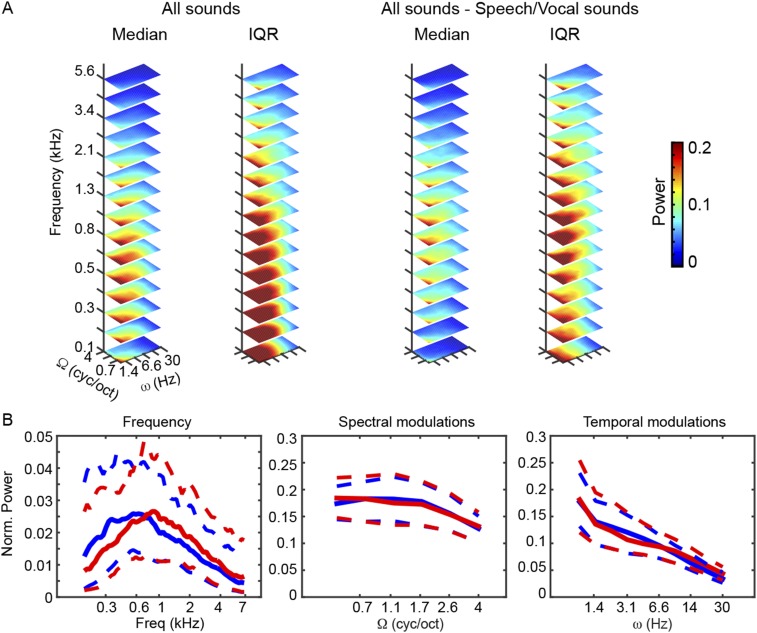
Fig. S4.
Modulation content of stimuli. (A) Median and IQRs of acoustic energy distribution for the complete stimulus set (Left) and for the reduced stimulus set without speech and vocal sounds (Right). Values are shown using a linear color scale, with the 0 color-coded in black. (B) Marginal profiles of the median energy distribution in A for the complete (blue) and reduced (red) stimulus sets. Dashed lines indicate the corresponding IQR. Freq, frequency, Ω, spectral modulation scale; ω, temporal modulation rate. Removal of speech and vocal sounds largely altered the relative contribution of low and high frequencies to the overall acoustic energy of the stimulus set used for training/testing the decoders (maximum reduction of 45% at f = 209.5 Hz, maximum increase of 46% at f = 6.8 kHz). For temporal and spectral modulations, the consequences on the relative energy distribution were smaller (maximum reduction of 11% at ω = 3.1 Hz, maximum increase of 28% at ω = 30 Hz; maximum reduction of 4% at Ω = 1.1 cyc/oct, maximum increase 6% at Ω = 0.5 cyc/oct). cyc/oct, cycles per octave.

