Fig. 4.
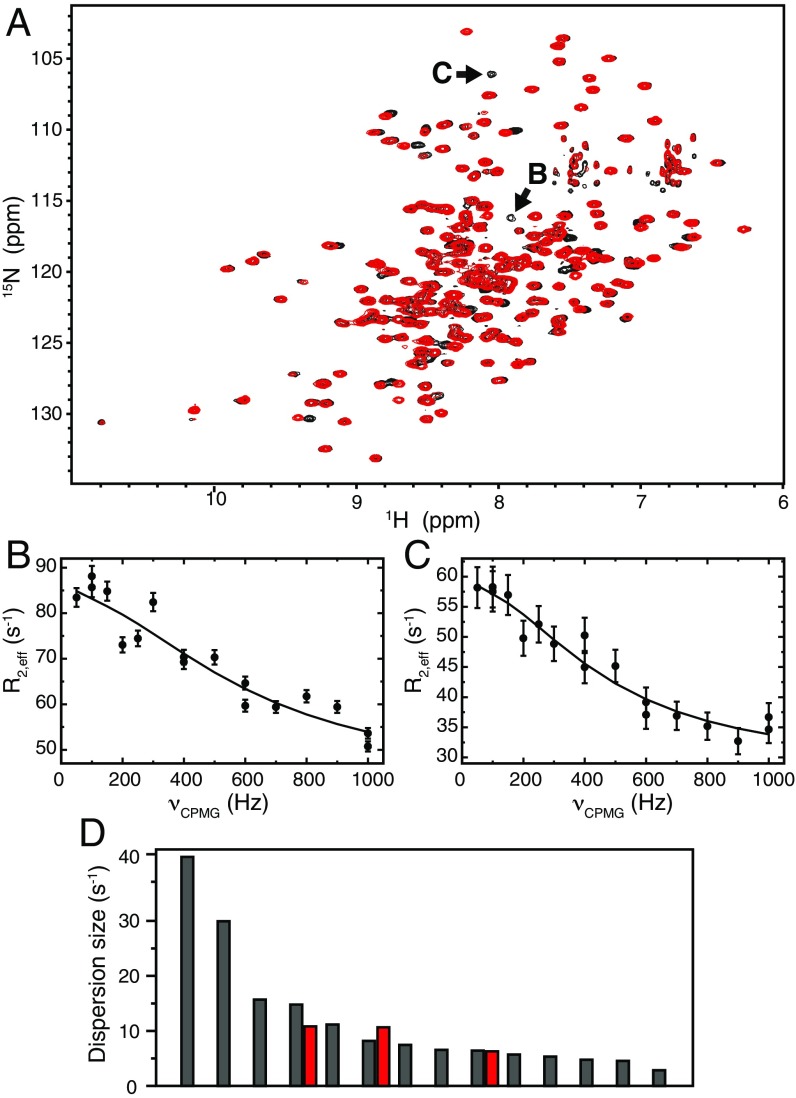
The solution structure of HisA(dup13-15/D10G) is similar to that of HisA(dup13-15), but more dynamic on the microsecond-millisecond time scale. (A) 15N-1H correlation maps of HisA(dup13-15/D10G) (black) and HisA(dup13-15) (red). (B and C) Relaxation dispersion profiles for the HisA(dup13-15/D10G) 15N resonances indicated with arrows in A. (D) Dispersion sizes for residues with significant 15N dynamics for HisA(dup13-15/D10G) (gray) and HisA(dup13-15) (red), sorted in order of decreasing dispersion size. The two leftmost gray bars correspond to the dispersions in B and C.

