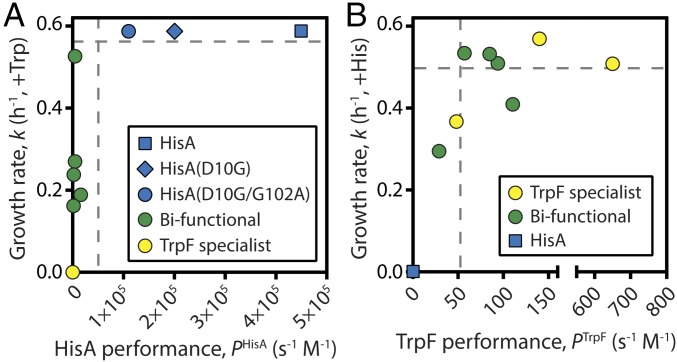
Fig. 6.
Phenotype-fitness maps for evolved HisA and TrpF enzymes. (A) Biphasic correlation between HisA performance and the cellular growth rate conferred by each enzyme in the absence of exogenous histidine (in presence of tryptophan). Each point represents one of the mutants characterized in this study. Performance and growth data are provided in Table 1 and SI Appendix, Table S1, respectively. (B) Correlation between TrpF performance and growth rate in the absence of tryptophan (in presence of histidine).

