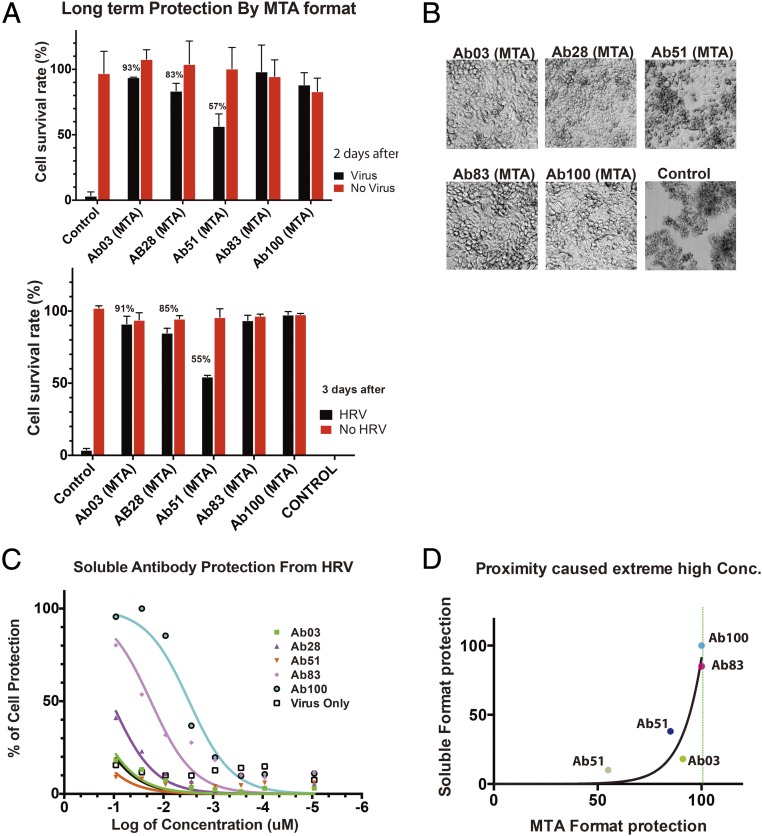
Fig. 3.
Protection by individual antibody clones. (A) Protection by individual clones in MTA format. (B) Representative images of cells protected by isolated clones in MTA virus format. (C) Protection by different soluble antibodies. (D) Correlation of protection by purified antibody and by antibodies in membrane-tethered format. Different colored dots stand for different antibody clones. For each antibody, the percentage of protection in soluble format is plotted versus the percentage of protection in MTA format. The data points fits an exponential growth function with a τ = 9.7.

