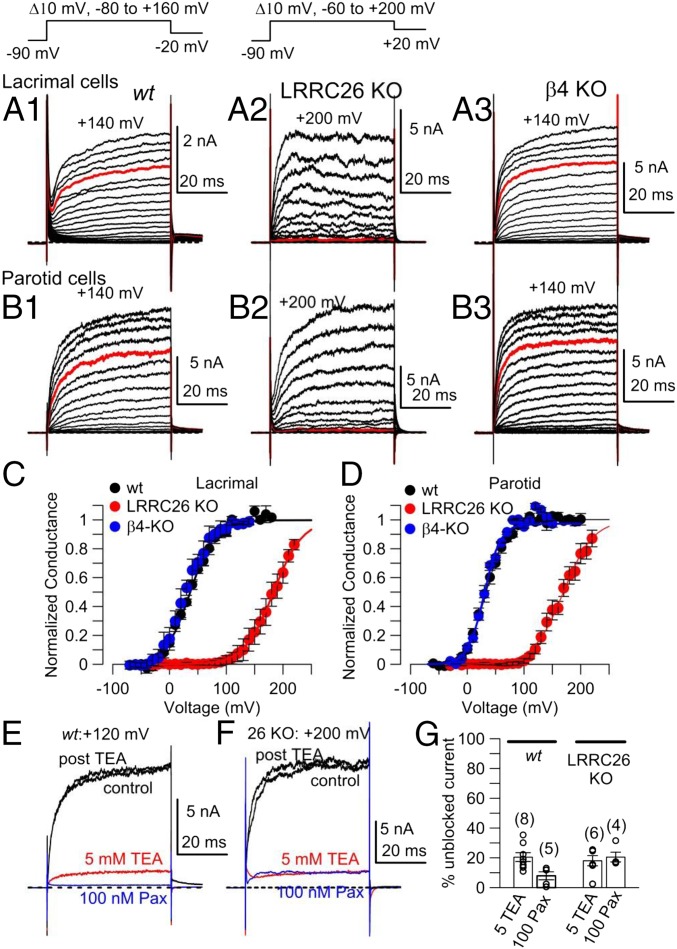
Fig. 4.
KO of LRRC26 shifts gating of lacrimal gland and parotid cell BK currents rightward. (A1) Currents (shown to +140 mV) were activated with the indicated voltage protocol in a wt lacrimal gland cell. Pipette/intracellular Ca2+ was 250 nM for all whole-cell recordings. (A2) Currents are shown from a LRRC26 KO lacrimal gland cell with steps to +200 mV. (A3) Currents are shown up to +140 mV from a β4-KO lacrimal gland cell. For all panels in A, red traces are at +100 mV. (B) Panels on the Left (B1), Middle (B2), and Right (B3) correspond to currents from wt, LRRC26-KO, and β4-KO parotid gland cells, activated by voltage protocols identical to those in A. (C) GV curves were generated from tail currents in lacrimal gland cells from wt (n = 4), LRRC26 KO (n = 4), and β4 KO (n = 3). For wt and β4 KO, tail currents were measured at −20 mV, and for LRRC26-KO, +20 mV. Vh and z values from means of fits to individual cells are: for wt, Vh = 36.7 ± 1.4 mV with z = 1.2 + 0.1e; for LRRC26 KO, Vh = 182.2 ± 9.5 mV, z = 1.1 ± 0.1e; for β4 KO, Vh = 30.0 ± 8.8 mV, z = 1.2 ± 0.02e. (D) GV curves were generated from tail currents in parotid cells as in C. From fits to individual cells, for 12 wt cells, mean Vh = 33.5 ± 1.5 mV and z = 1.6 ± 0.1e; for 12 LRRC26 KO cells, Vh = 163.2 ± 6.7 mV with z = 1.3 ± 0.1e. Fit of averaged GVs yielded similar values: for wt, Vh = 33 with z = 1.3e, and for LRRC26 KO, Vh = 169.5, with z = 1.0e. (E) Traces show inhibition at +120 mV (maximal BK activation) by 5 mM TEA and 100 nM paxilline (Pax) in a wt parotid cell. (F) Traces shown inhibition at +200 mV (maximal activation) by 5 mM TEA and 100 nM paxilline in a LRRC26 KO parotid cell. (G) The mean % of current remaining compared with control in 5 mM TEA or 100 nM paxilline is plotted for wt and LRRC26 KO parotid cells, with open circles corresponding to individual cells.

