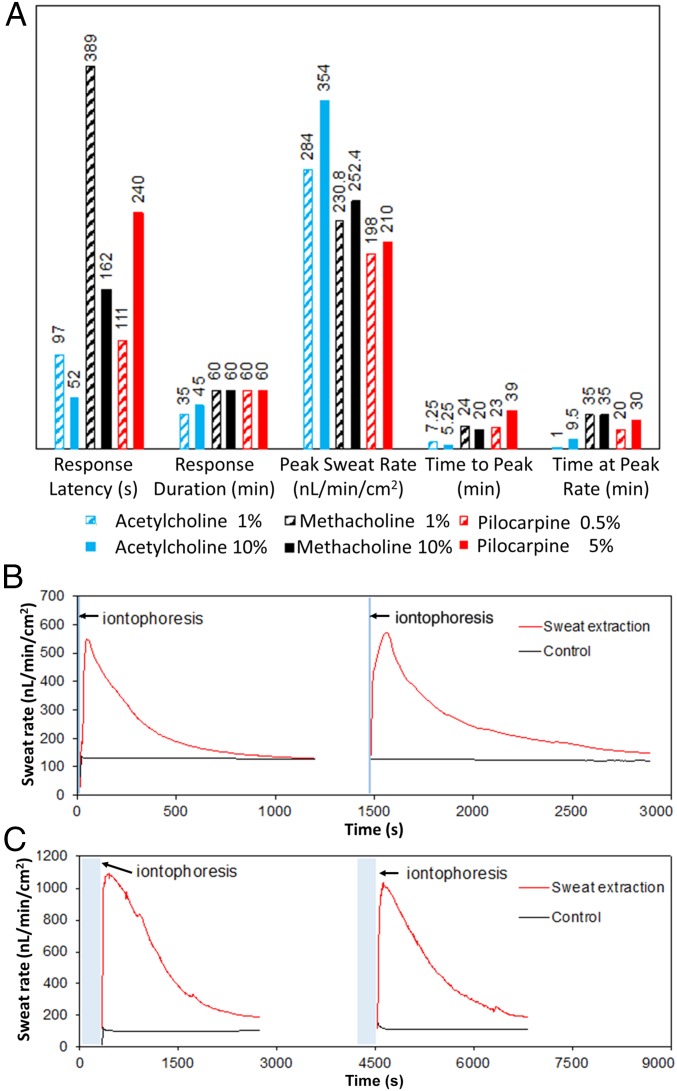
Fig. 3.
(A) Induced sweat-secretion rate characteristics in response to three different custom-developed cholinergic agonist hydrogels with two different concentrations: acetylcholine (blue), methacholine (black), and pilocarpine (red). Bars represent values for response latency (time in seconds to onset of secretion from start of iontophoresis), response duration (total time in minutes of secretion above baseline, measurements stopped at 60 min), peak secretory rate in response to stimulation, time to reach peak secretory rate, and time spent secreting at the peak rate. (B) Sweat-rate profile pertaining to periodic sweat induction using acetylcholine 1%-based hydrogel with iontophoresis current of 1 mA for 10 s. (C) Sweat-rate profile pertaining to periodic sweat induction using acetylcholine 10%-based hydrogel with iontophoresis current of 1 mA for 5 min (bottom panel). The control curves in B and C represent the sweat-rate profile in the contralateral arm without iontophoresis.

