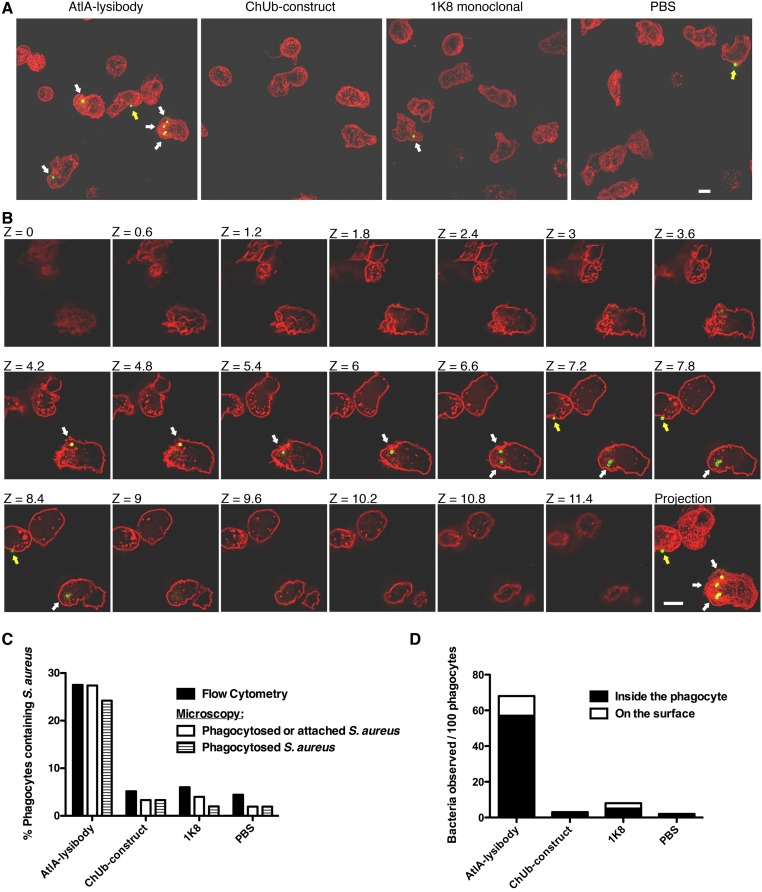
Fig. S9.
Comparison of the level of phagocytosis as determined by flow cytometry and high-resolution microscopy. HL-60 neutrophils were incubated with FITC-labeled S. aureus strain Wood 46 in the presence of lysibodies and S. aureus-adsorbed human complement. Cells were fixed, and each sample was divided for analysis by flow cytometry and deconvolution fluoresce microscopy. For microscopy, the cells were further stained with WGA Alexa Fluor 594 conjugate. (A) Representative images of cells treated with AtlA lysibody, ChUb construct, nonspecific 1K8 monoclonal, or PBS alone. Images are presented as maximum intensity projections (scale bar, 5 μm). White arrows represent internalized staphylococci, and yellow arrows represent staphylococci attached to the surface of phagocytes. (B) An example of the technique used to determine whether bacteria are intracellular or extracellular. The Z sections at 0.6-μm intervals are presented; intracellular bacteria are denoted with white arrows, and extracellular bacteria are denoted with yellow arrows (scale bar, 5 μm). (C) At least 150 neutrophils for each treatment group were evaluated by high-resolution fluorescence microscopy for the presence of intracellular and extracellular staphylococci. The results are presented alongside the flow cytometry results obtained from the same sample. (D) For each treatment group, the number of intracellular and extracellular bacteria observed by high-resolution fluorescence microscopy per 100 neutrophils is presented.

