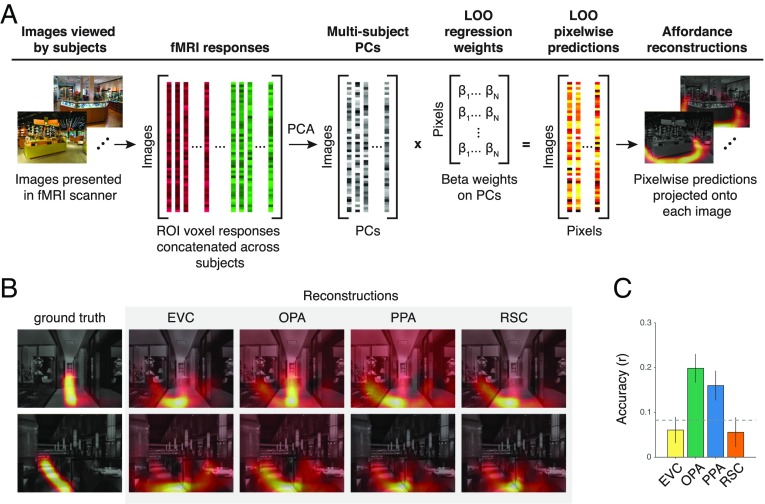
Fig. 4.
Reconstruction of navigational-affordance maps. (A) Navigational-affordance maps were reconstructed from the fMRI responses within each ROI. First, a data-fusion procedure was used to create a set of multisubject ROI responses for use in the reconstruction model. For each ROI, principal component analysis (PCA) was applied to a matrix of voxel responses concatenated across all subjects. The resulting multisubject PCs were used as predictors in a set of pixelwise decoding models. These decoding models used linear regression to generate intensity values for individual pixels from a weighted sum of multisubject fMRI responses. The ability of the models to reconstruct the affordances of novel stimuli was assessed through LOO cross-validation on each image in turn. (B) Example reconstructions of navigational-affordance maps from the cortical responses in each ROI. (C) Affordance maps were reconstructed most accurately from the responses of the OPA. Bars represent the mean accuracy across images. Error bars represent ± 1 SEM. The dashed line indicates chance performance at P < 0.05 permutation-test FWE.

