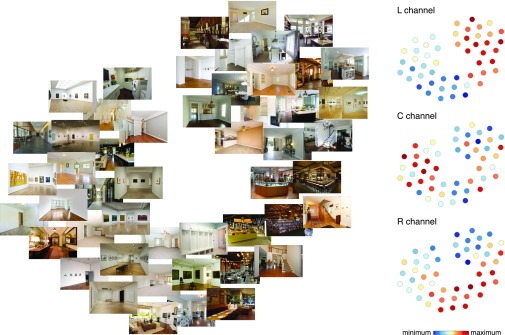
Fig. S7.
Visualization of the navigational-affordance RDM. Using t-distributed stochastic neighbor embedding (t-SNE; perplexity set at 30), a 2D embedding was created that best captures that representational distances of the model RDM (shown in Fig. 3C). The Left panel shows how the stimulus images are arranged in this embedding. The plots on the Right illustrate the response level for each stimulus in the affordance channels of the encoding model (C, center; L, left; R, right; see also Fig. 3B). Colors are scaled to the minimum and maximum within each channel.

