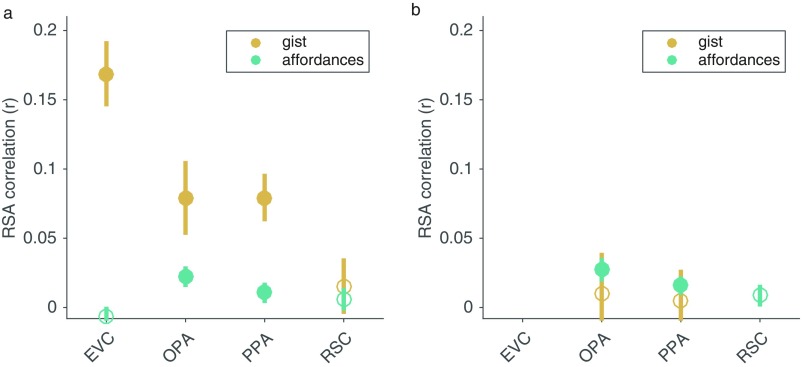
Fig. S8.
Comparison of RSA effects for navigational affordances and Gist features. (A) Partial correlation analyses were used to identify the RSA correlations that could be uniquely attributed to each model. The RSA effects for the Gist model were strongest in EVC, whereas the effects of the affordance model were strongest in the OPA and PPA. (B) After partialling out the variance of the EVC RDM from each of the other ROIs, the effects of the affordance model remained significant in the OPA and PPA, but the effects of the Gist model dropped and were no longer significant. Error bars represent ±1 SEM. Filled circles indicate significant effects at P < 0.05.

