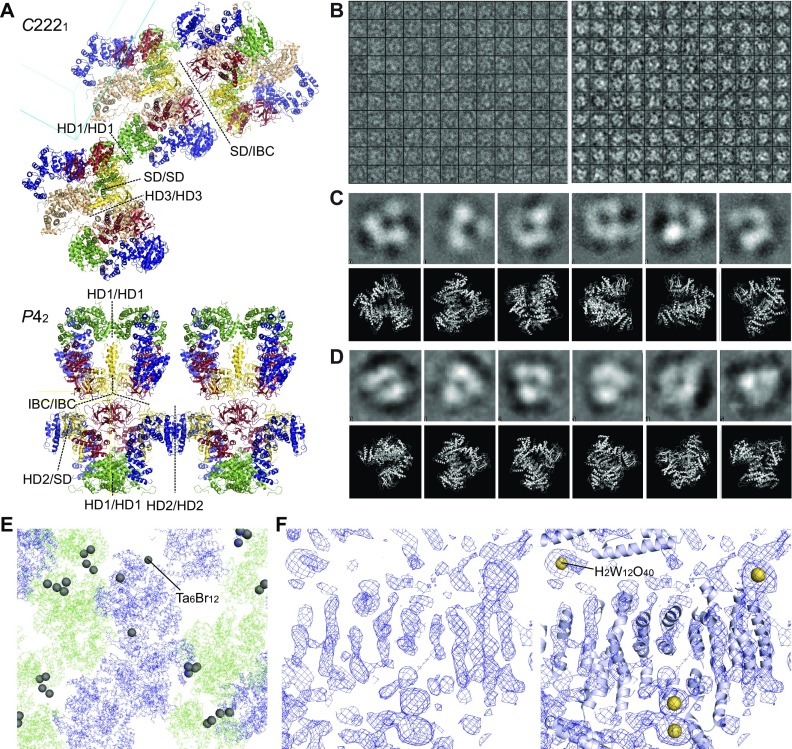
Fig. S2.
Crystallographic analyses and validations of IP3R2217 and IP3R1585. (A) Ribbon representations of IP3R2217 in the C2221 crystal lattice (Upper) and IP3R1585 in the P42 crystal lattice (Lower). The contacts between adjacent molecules are shown by dotted lines. Cyan and yellow lines indicate axes of unit cells. (B) Boxes (180 Å × 180 Å) showing the IP3R2217 particles picked from a cryo-EM micrograph obtained on a JEM-2100F microscope (Left) and micrograph of negative-stained IP3R obtained on an FEI Tecnai 12 electron microscope (Right). The mean particle diameter of negatively stained particles was 140 ± 13 Å (n = 19). (C and D) Characteristic class averages of cryo-EM images (C) and negative-stained particles (D) are shown in the upper rows, and the lower rows show obtained crystal structures, manually fitted to each class average. (E) Experimental phasing using heavy atom clusters. Heavy atom sites (Ta6Br12) in the C2221 crystal determined by SAD. (F) A density modified map solved by MR-SAD experimental phasing with H2W12O40 tungsten clusters (Left), and our model superimposed with the map as a reference (Right).

