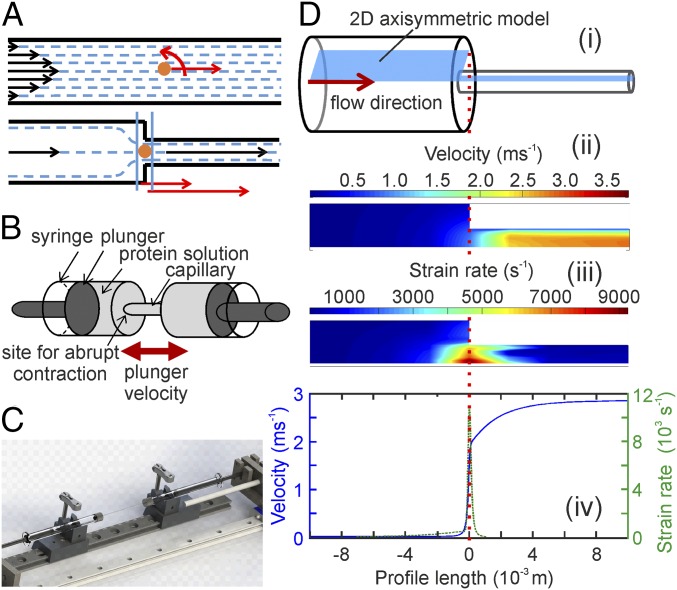
Fig. 1.
Design of extensional flow apparatus and validation of the generated flow field using CFD. (A) The differences between shear- (Top) and extensional flow (Bottom). Solid black arrows indicate velocity; dashed lines show streamlines indicative of flow direction. The orange dot in both diagrams represents a protein as a sphere in the flow. The curved red arrow represents rotation due to shear. Straight red arrows indicate the relative velocity of the protein, which differs before and after the contraction in the extensional flow. (B) Schematic of the extensional flow apparatus showing two syringes connected by a single capillary. (C) Image of the extensional flow device. (D, i) A 3D schematic of the contraction geometry where the barrel of the syringe meets the capillary (dotted red line shows the location of the contraction). The 2D axisymmetric approximation used for CFD analysis is superimposed in blue. CFD results of the extensional flow region showing the flow-velocity (D, ii) and strain-rate (D, iii) profiles for a typical flow with a plunger velocity (average inlet velocity) of 8 mms−1 (centerline strain rate = 11,750 s−1). (D, iv) Velocity and strain rate along a streamline located on the axis of symmetry at a plunger velocity of 8 mms−1.

