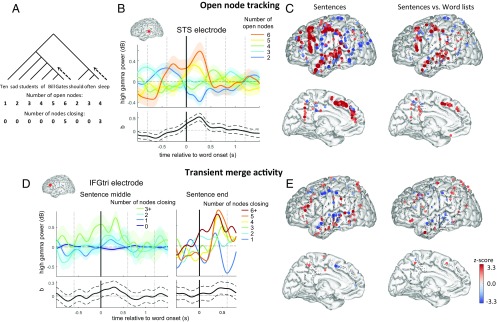
Fig. 2.
Tracking of open nodes and nodes closing. (A) The number of open nodes and number of nodes closing upon each word are shown below the tree structure diagram for an example sentence. These variables are related by the expression that for word n in the sentence: nOpenNodesn = nOpenNodesn–1 – nNodesClosingn-1 + 1, with boundary conditions that nOpenNodes0 = 0, nNodesClosing0 = 0, and nOpenNodesk+1 = 1 for a sentence of length k. (B) For an example STS electrode, each trace in Upper shows the average profile when the corresponding number of open nodes is present upon the presentation of the word at time 0. Lower shows the temporal profile of the ANCOVA coefficient evaluating the effect of the number of open nodes on high-gamma power (i.e., the linear relationship from cool to warm colors above) with its 95% confidence interval in dashed lines. To avoid effects from the startup of the sentence from dominating the plot, the data were normalized by word position, and the first two words of the sentence were discarded. (D) For an IFG electrode, each trace in Upper shows the average profile when the corresponding number of nodes closing upon the presentation of the word at time 0, with the entire trace normalized by the number of open nodes for the word at time 0. Left plots show activity during the sentence. Right plots show the same for the last word of the sentence only. There were fewer words with a large number of node closings during the sentence than at sentence ending, which necessitated the different groupings between the two plots. The plot below shows the temporal profile of the ANCOVA coefficient measuring the impact of node closings on high-gamma power. (C and E) Multiple regression model simultaneously modeling the effects of number of open nodes (C) and number of nodes being closed (E). The z scores for the corresponding regressors are shown for the sentence task (Left) and the interaction of the regressors across the sentence and word list tasks (Right), where positive indicates a larger coefficient in the sentence task. SI Appendix, Table S2 shows the result of significance tests across electrodes and across subjects for each ROI.

