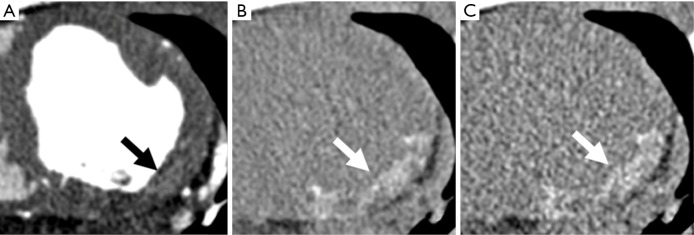
Figure 2.
CCT in a porcine model with induced myocardial infarction. First-pass CCT shows early and subtle perfusion defects (black arrow) on the subendocardial lateral wall of the left ventricle corresponding to the perfusion territory of the left circumflex coronary artery (A). Corresponding DE-CCT images performed with standard contrast bolus using a low-dose radiation of 350 mAs (B) and standard 900 mAs (C). DE-CCT shows a good correlation with acute infarct size (white arrow).

