
Figure 1.
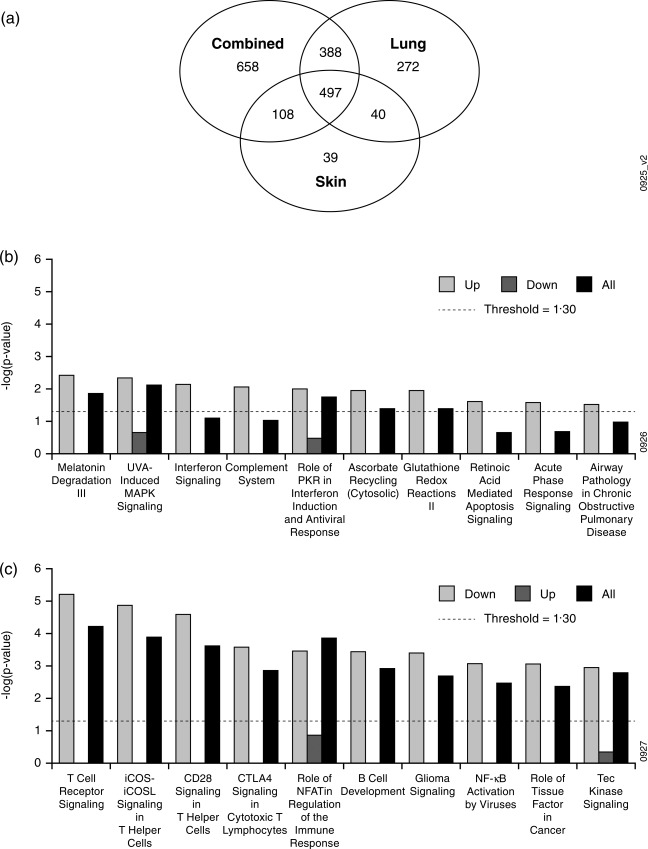
Identification and analysis of the core sarcoidosis signature. (a) Probesets derived from whole blood microarray comparison of sarcoidosis subjects and healthy controls (Table 1) were compared for each phenotype. (b,c) Probesets included in the core signature (497 probesets shared by all three phenotypes) were analysed with Ingenuity Pathway Analysis. The core signature was analysed in its entirety (All) and also separately as up‐ and down‐regulated genes (Up, which contained 110 probesets, and Down, which contained 387 probesets, respectively) relative to healthy controls. Pathway enrichments were sorted for the top 10 most significantly enriched pathways for the (b) up‐regulated genes and (c) down‐regulated genes. The y‐axes indicate the significance of enrichment for a given signature from Ingenuity's knowledge base. Enrichment scores less than the value indicated by the dashed line were not considered significant.