
Figure 2.
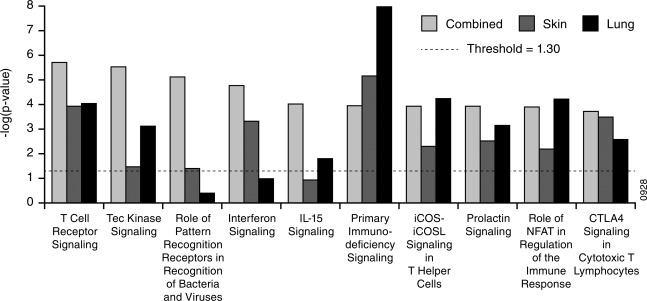
Comparison of sarcoidosis phenotype signatures. Pathway enrichment was performed using Ingenuity Pathway Analysis for the phenotype signatures listed in Table 1; y‐axes indicate the significance of enrichment for a given signature from Ingenuity's knowledge base. Enrichment scores less than the value indicated by the dashed line were not considered significant. The number of subjects per group can be found in Table 1.