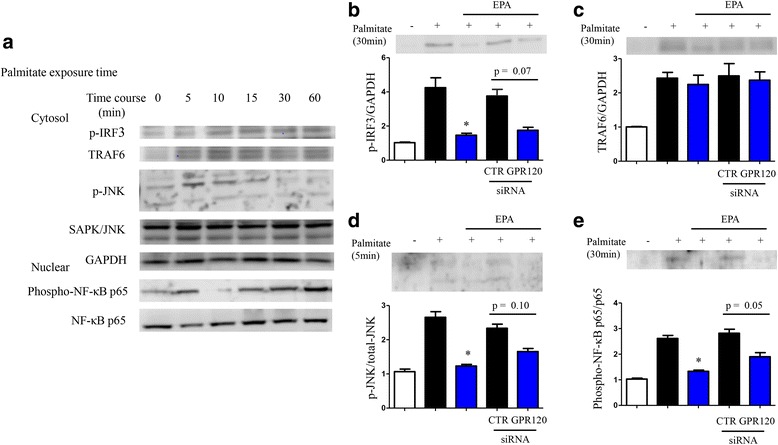
Fig. 2.

Time course of palmitate-induced expression of inflammatory molecules in 3T3-L1 adipocytes by western blot analysis (a). Relative protein expression levels of phosphorylated IRF3, TRAF6, phosphorylated JNK (cytosolic), and phosphorylated NF-κB p65 (nuclear) were adjusted according to control protein expression levels (GAPDH, total-JNK, and NF-κB p65; b–e). Data are presented as the mean ± SEM of three independent experiments. *P < 0.05 vs. palmitate exposure (5 or 30 min). CTR; scramble siRNA
