FIGURE 5.

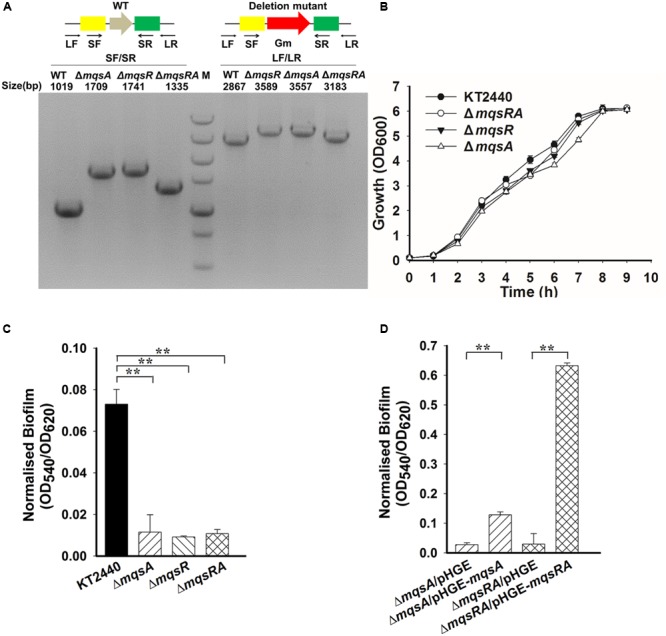
MqsA and MqsR affect biofilm formation. (A) Deletion of mqsR, mqsA, and mqsRA operon in P. putida KT2440 are checked by PCR. PCR products are indicated with the expected sizes using genomic DNA from the wild-type (WT) and the deletion mutants. M indicates DNA ladder (500, 750, 1000, 1500, 2000, 3000, and 5000 bp). (B) Growth of different strains in LB medium. (C) Attached biofilm formation of different strains quantified in the 96-well polystyrene plate. (D) Attached biofilm formation of different strains (with 0.5 mM IPTG) using the 96-well polystyrene plate assay in LB medium. Three independent cultures for each strain were used and the data are shown as means ± standard deviations. Asterisks represent a statistically significant difference in C and D. (P < 0.01 was shown in ∗ and P < 0.001 was shown in ∗∗; n = 3).
