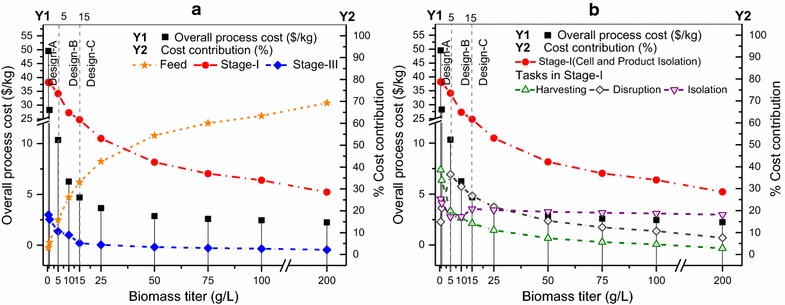
Fig. 5.

Overall process cost and contributions by feed, separation stages, and tasks with varying biomass titer. a Overall process cost (Y1) and cost contribution (Y2) by feed, and active separation stages I and III. b Cost contribution (Y2) by the three tasks in stage I: cell harvesting, cell disruption, and product isolation. The vertical dotted lines at 5 and 15 g/L represent the change in optimal separation network design
