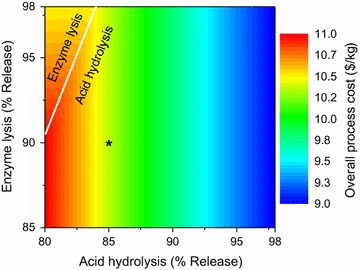
Fig. 8.

Overall process cost with variation in performance of cell disruption technologies. Direction of the contour lines denotes the viable region for the two technologies available for cell disruption: acid hydrolysis and enzyme lysis. They are horizontal where enzyme lysis is selected, whereas vertical where acid hydrolysis is selected. Critical values, when there is a change in technology selection from acid hydrolysis to enzyme lysis, are shown by white lines
