
Fig. 3.
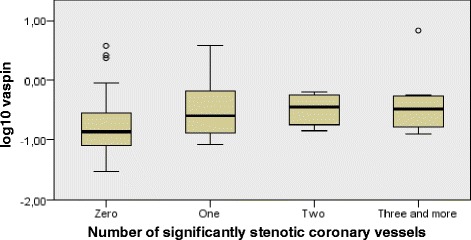
Independent samples Kruskal - Wallis test of vaspin differences in various NrSSV groups. Legend: The boxplot of log10 vaspin across specific groups of patients differing in the number of significantly stenotic coronary arteries. PTP: Pre – test probability; NrSSV: Number of significantly stenotic coronary vessels