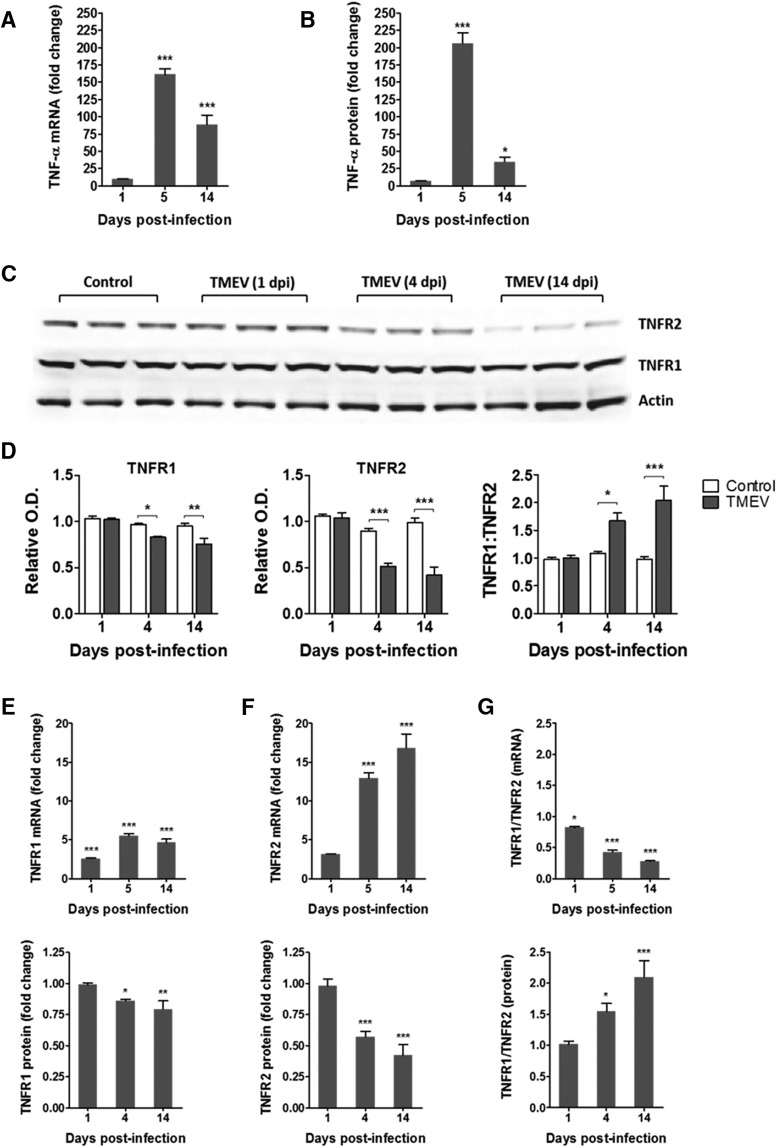
Figure 4.
Increase in the levels of TNFα and in a ratio of the protein expression of TNFR1:TNFR2 in the hippocampus of TMEV-infected mice during acute seizure activity period. (A) mRNA levels of TNFα, as measured by RT-qPCR, are significantly increased in TMEV-infected mice at 5 and 14 dpi by 161- and 88-fold, respectively, compared with PBS-infected control mice (n = 4 for TMEV and control). (B) 206- and 35-fold increase in the protein expression levels of TNFα in TMEV-infected mice at 5 and 14 dpi compared with the PBS-injected control mice [control, n = 5; TMEV, n = 8 (1 dpi), 6 (5 dpi), and 5 (14 dpi)]. (C) Representative immunoblot shows the protein expression of TNFR1, TNFR2, and actin in the hippocampus from PBS- and TMEV-infected mice (n = 3). (D) Densitometric analysis of the immunoblots shows the expressions of TNFR1 and TNFR2 normalized to the expression levels of actin [control, n = 5; TMEV, n = 5 (1 dpi), 6 (4 and 14 dpi)] O.D., optical density. Relative expression levels of TNFR1 and TNFR2 (TNFR1:TNFR2) are significantly increased by 1.54- and 2.1-fold at 4 and 14 dpi, respectively, in TMEV-infected mice compared with control mice. (E) mRNA levels of TNFR1 and TNFR2 in the hippocampus of TMEV-infected mice before (1 dpi), during (5 dpi), and after (14 dpi) acute seizures. The ratio of TNFR1 to TNFR2 mRNA is significantly reduced during the acute infection period. Data are shown as mean ± SEM. Statistics: two-way ANOVA followed by Bonferroni posttest; *, p < 0.05; **, p < 0.01; ***, p < 0.001.

