
Fig. 6.
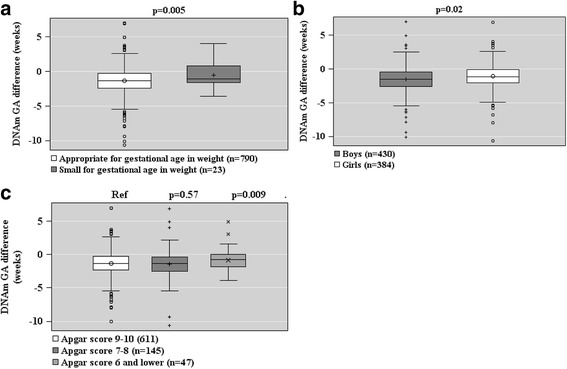
Associations between offspring small for gestational age (GA) weight at birth (panel a), sex (panel b), and Apgar score (panel c), and raw DNAm GA difference (DNAm GA-GA) of the offspring at birth based on fetal cord blood methylation data. Associations are adjusted for cell-type composition and population stratification estimated with two multi-dimensional scaling components based on genome-wide data. Data shown are median, interquartiles, and range. p values refer to group differences. Ref referent group