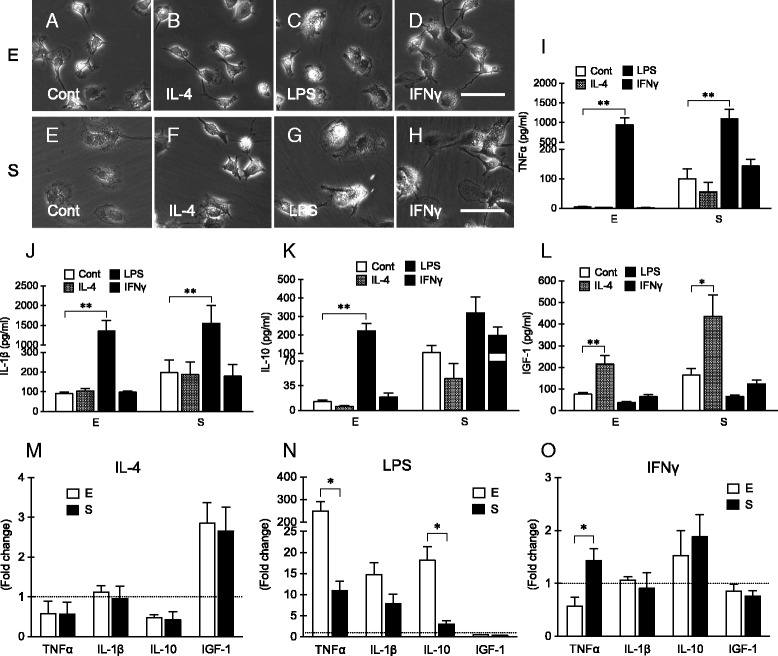
Fig. 5.

Morphological change (a–h) and cytokines release (i–l) of primary cultured microglia isolated using mild trypsinization (E) or shaking (S) after treatment with 20 ng/ml of IL-4, 50 ng/ml of LPS, or 20 ng/ml of IFNγ for 24 h. n = 4. Scale bar = 50 μm. m–o Reanalysis of data of cytokines release from primary cultured microglia isolated using mild trypsinization (E) or shaking (S) after treatment with 20 ng/ml of IL-4 (m), 50 ng/ml of LPS (n), or 20 ng/ml of IFNγ (o) for 24 h. Data were presented as fold changes compared with control. *p < 0.05; **p < 0.01
