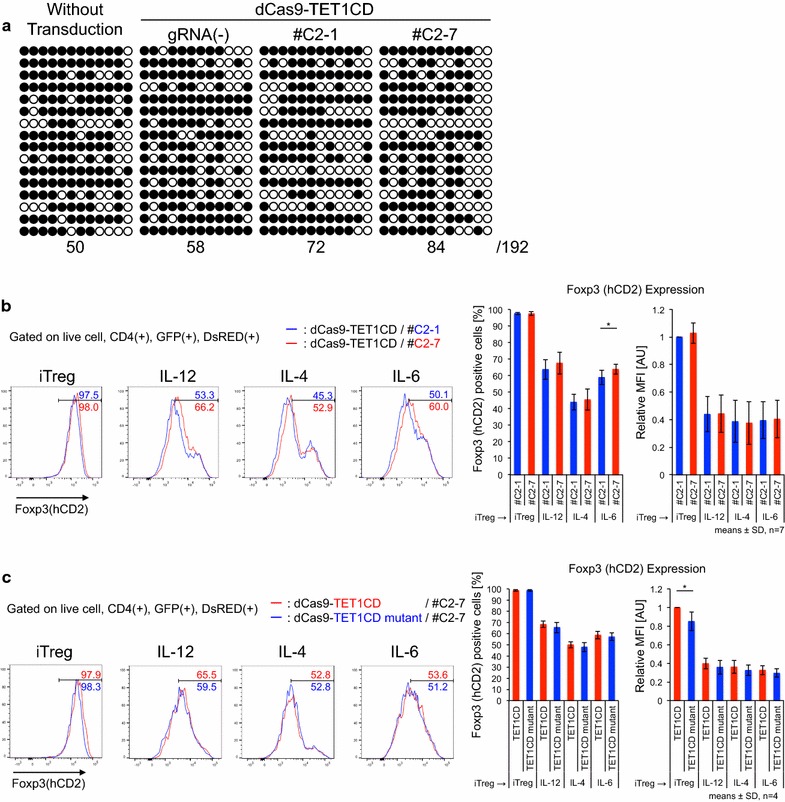
Fig. 3.

Maintenance of Foxp3 expression induced by dCas9-TET1CD-mediated demethylation of the Foxp3 CNS2 locus. a The methylation status of CpG sites at the Foxp3 CNS2 locus in untransduced, dCas9-TET1CD single, with #C2-1, and with #C2-7 transduced iTregs was determined by bisulfite sequence analysis. GFP/DsRed(−/−), (+/−), and (+/+) cells are sorted, respectively. A horizontal row depicts one sequence clone in which CpGs was methylated (black) or demethylated (white). The number below bisulfite sequences indicates demethylated CpG sites. Data are pooled from two independent experiments. (b and c) Flow cytometry analysis of Foxp3(hCD2) expression in iTregs co-transduced with dCas9-TET1CD and gRNA CNS2 #C2-1 (blue) or #C2-7 (red) (b), dCas9-TET1CD (red), or TET1CD mutant (blue) and gRNA #C2-7 (c) under inflammatory cytokine conditions. Percentages of Foxp3(+) and mean fluorescence intensity (MFI) relative value to iTregs co-transduced with dCas9-TET1CD and #C2-1 (b), dCas9-TET1CD and #C2-7 (c) were plotted. Data are pooled from seven (b) or four (c) independent experiments and represent the means ± SDs. *p < 0.05
