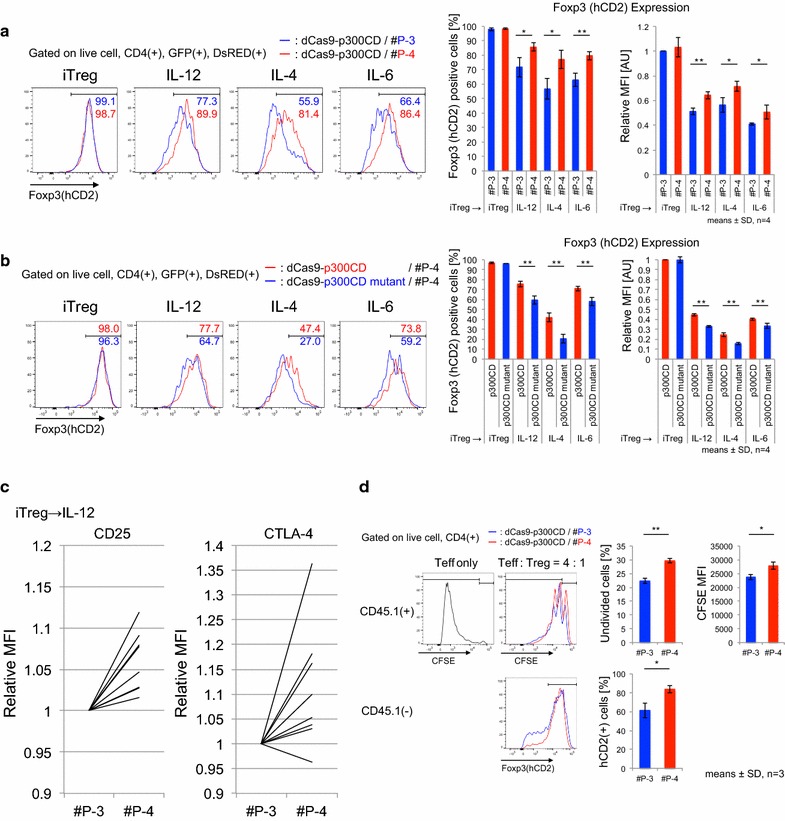
Fig. 6.

dCas9-p300CD-applied iTregs showed higher suppressive activity. a and b Flow cytometry analysis of Foxp3 (hCD2) expression in iTregs co-transduced with dCas9-p300CD and gRNA #P-3 (blue) or #P-4 (red) (a), dCas9-p300CD (red) or p300CD mutant (blue) and #P-4 (B). Percentages of Foxp3(+) cells and MFI relative value to iTregs co-transduced with dCas9-p300CD and #P-3 (a) or dCas9-p300CD and #P-4 (b) were plotted. Data are pooled from four independent experiments and represent the means ± SDs. *p < 0.05; **p < 0.01. b Relative expression of CD25 or CTLA-4 of IL-12-treated iTregs co-transduced with dCas9-p300CD and gRNAs. Relative MFI values to #P-3 were plotted. Data represent each experimental value of eight independent experiments. c Treg suppression activity was measured by CFSE dilution in labeled Teff. Flow cytometry analysis of CFSE dilution in labeled Teff, co-cultured with or without iTregs co-transduced with dCas9-p300CD and gRNA #P-3 (blue) or #P-4 (red). Foxp3 (hCD2) expression in iTregs co-transduced with dCas9-p300CD and gRNA #P-3 (blue) or #P-4 (red) was also analyzed. Data are pooled from three independent experiments and represent the means ± SDs. *p < 0.05; **p < 0.01
