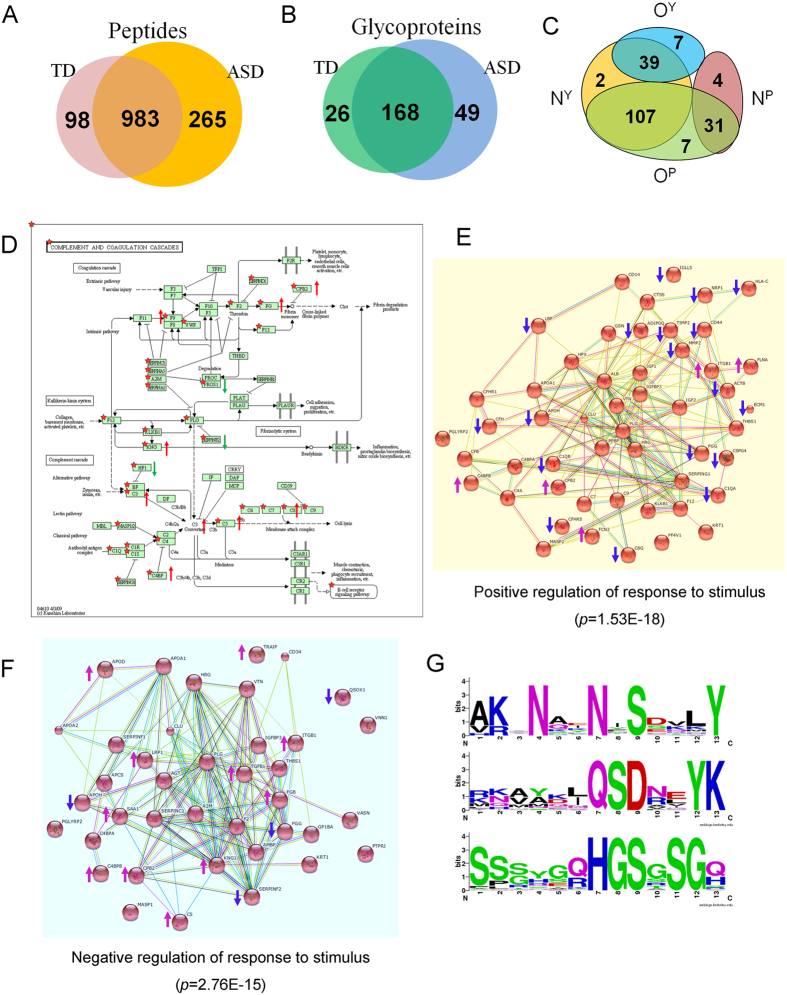
Figure 3. Characterization and bioinformatic analysis of MAL-II binding glycoproteins (MBGs).
(A,B) Identification of peptides and their corresponding glycoproteins in TD and ASD sera by LC-MS/MS. (C) Proportion of known N-glycoproteins (NY) and O-glycoproteins (OY) by UniProtKB/Swiss-Prot database and the predicted glycoproteins with potential N-glycosylation sites (NP) and potential O-glycosylation sites (OP). (D) KEGG pathway analysis of the identified MBGs (marked with a red star) in complement and coagulation cascades60. Red arrow, up-regulation of MBGs; green arrow, down-regulation of MBGs in ASD. Protein interaction network analysis of the identified MBGs (red sphere) that were up-regulated (red arrow) or down-regulated (blue arrow) in positive regulation (E) and negative regulation (F) of response-to-stimulus processes in ASD sera. (G) Possible N-glycosylation and O-glycosylation motifs around asparagine and serine residues for the α2-3-linked sialylated glycopeptide domain. WebLogo generated relative frequency plots of the significant sequence motif. The heights of the residues are approximately proportional to their binomial probabilities.

