Figure 3.
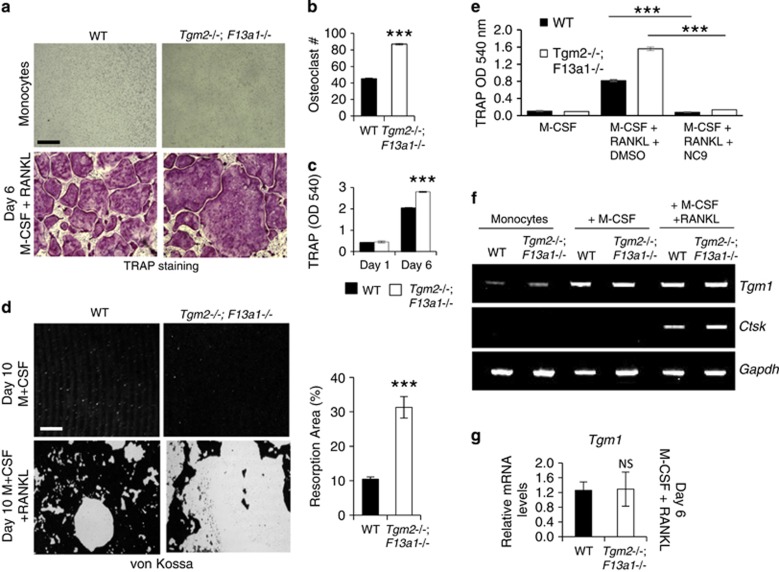
Monocytes from Tgm2−/−;F13a1−/− mice show increased differentiation into osteoclasts in vitro – chemical inhibition of TG activity, however, blocks osteoclastogenesis due to presence of TG1. (a) Bone marrow monocytes isolated from 2-month-old mice were differentiated into osteoclasts with M-CSF and RANKL for 6 days. Tartrate-resistant acid phosphatase (TRAP) staining of the cultures showing increased osteoclast numbers and increased size in the combined absence of TG2 and FXIII-A. Images are representative of three separate experiments. (b) Osteoclast counts from the cultures show a twofold increase in osteoclast numbers from Tgm2−/−;F13a1−/− monocytes. n=3 (three separate experiments). (c) Quantification of TRAP staining from media shows significant increase in Tgm2−/−;F13a1−/− cultures. Triplicate analysis from three separate experiments is presented. (d) Tgm2−/−;F13a1−/− osteoclasts show dramatically increased resorption activity as visualized by resorption pit assay on mineral coated plates. Images are representative of three experiments. Quantification of the resorbed area (%) shows significantly increased, threefold osteoclast activity of Tgm2−/−;F13a1−/− osteoclasts. n=3. (e) Chemical inhibition of TG activity with NC9 in WT and Tgm2−/−;F13a1−/− cultures, however, shows complete attenuation of osteclastogenesis suggesting presence of other TGs. Triplicate analysis from three separate experiments in presented. (f) RT-PCR analyses of Tgm1 expression during osteoclastogenesis shows increase upon M-CSF stimulation in both WT and Tgm2−/−;F13a1−/− cells. Representative data from three separate experiments is shown. (g) qRT-PCR analysis shows that Tgm1 is not upregulated in Tgm2−/−;F13a1−/− osteoclasts. n=3. P-values are as follows: ***P<0.001. NS; not significant. Scale bars, 200 μm

