Figure 7.
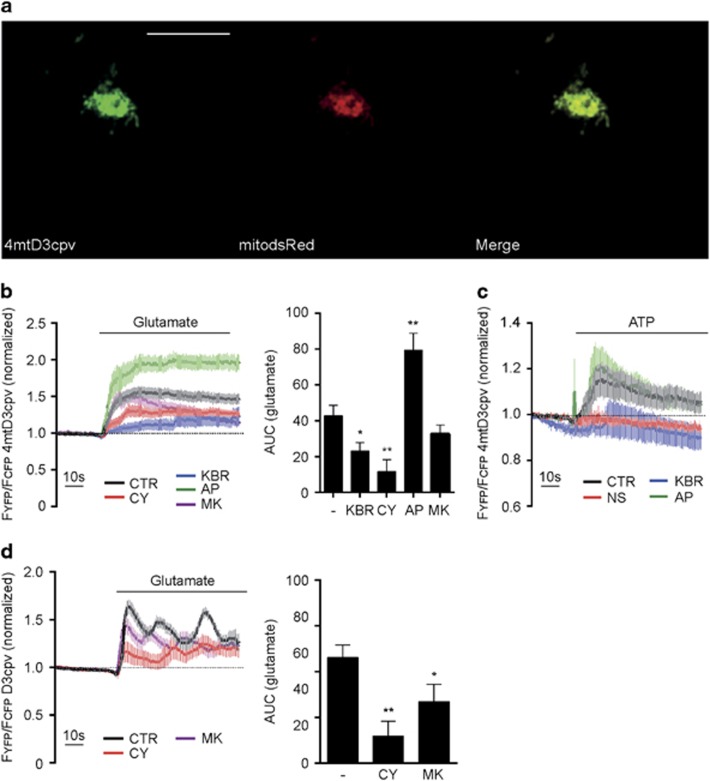
SK channel activation reduces mitochondrial calcium uptake in PCN. (a) Representative confocal images of PCN expressing the FRET sensor and mitochondrial dsRed (mitodsRed). Scale bar: 10 μm, n=5. (b) FRET recordings of PCN expressing 4mtD3cpv following glutamate stimulation. Left panel: FRET traces after pre-treatment with CyPPA (CY; red line), KB-R7943 (KBR; blue line), apamin (AP; green line) and MK801 (MK; purple line). Each trace was normalized to the initial value. Right panel: quantification of FRET recordings as area under curve after glutamate stimulation. Data are shown as mean±SEM, n=8–20. *P<0.05, **P<0.01 compared to control. (c) FRET recordings of PCN expressing 4mtD3cpv following ATP stimulation after pre-treatment with NS309 (NS; red line), KB-R7943 (KBR; blue line) and apamin (AP; green line) following ATP stimulation. Each trace was normalized to the initial value. Data are shown as mean±SEM, n=8–20. *P<0.05, **P<0.01 compared to control. (d) FRET recordings of PCN expressing D3cpv following glutamate stimulation after pre-treatment with CyPPA (CY; red line) or MK801 (MK; purple line). Each trace was normalized to the initial value. Data are shown as mean±SEM, n=10–15. *P<0.05, **P<0.01 compared to control

