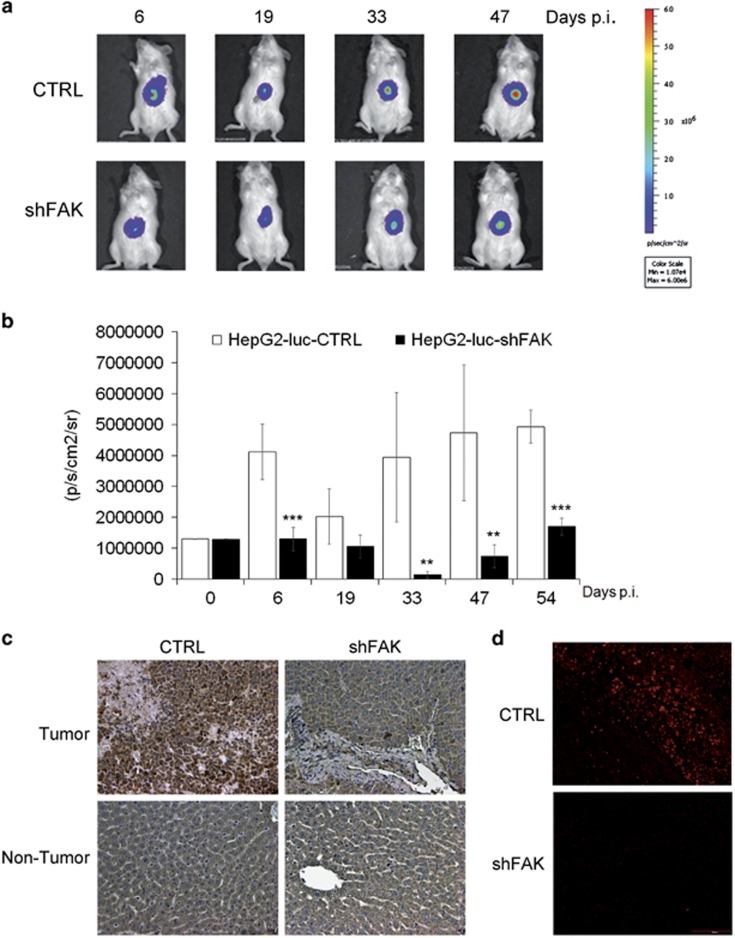
Figure 2.
FAK depletion impairs HCC growth in mouse xenograft models. (a) Representative imaging of NOD/SCID mice bearing intrahepatic tumors from respectively HepG2-luc-CTRL (CTRL) and HepG2-luc-shFAK cells (shFAK). (b) Quantitative analysis of luciferase activity in vivo at various time points. The luminescence signals are expressed as mean±SD of total flux of photon/sec/cm2/steradian (p/s/cm2/sr) (**P<0.01; ***P<0.001; n=6). (c) Representative IHC of FAK expression in liver samples (tumor and non-tumor) from CTRL and shFAK xenografts at 54 days p.i. (×20 magnification). (d) Representative IF of PCNA expression in intrahepatic tumor samples from CTRL and shFAK xenografts at 54 days p.i. (×20 magnification)

