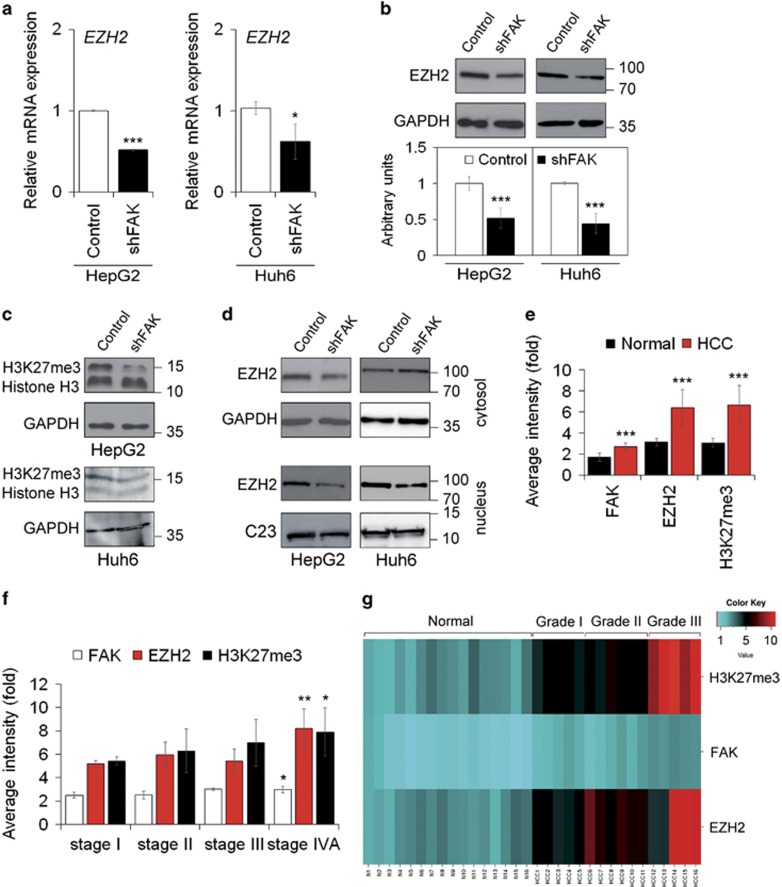
Figure 4.
FAK silencing influences EZH2 expression and activity in HCC cells. (a) Relative mRNA expression of EZH2 gene as measured by quantitative Real-Time PCR (qRT-PCR) in Control and shFAK HepG2 and Huh6 cells. Values are expressed as fold mean±SD (*P<0.05; ***P<0.001; n=3). (b) Representative WB and densitometric quantification for EZH2 protein in Control and shFAK HepG2 and Huh6 cells. GAPDH is reported as a loading control (***P<0.001; n=3). (c) Representative WB of H3K27me3 in Control and shFAK HepG2 and Huh6 cells. GAPDH is reported as a loading control (n=2). (d) Representative WB of cytosolic and nuclear EZH2 protein in Control and shFAK HepG2 and Huh6 cells. GAPDH and C23 are reported as loading controls (n=2). (e) Average fluorescence intensity calculated for FAK, EZH2 and H3K27me3 in liver tumor (HCC) and non-tumor (Normal) samples from the same patients (n=16). Values are plotted as mean±SD (***P<0.001). (f) Average fluorescence intensity calculated for FAK, EZH2 and H3K27me3 in HCC samples according to tumor staging. Values are plotted as mean±SD (*P<0.05; **P<0.01). (g) Heatmap representation of the expression of FAK, EZH2 and H3K27me3 in Normal tissues and HCC according to grade of disease (I, II, II). This image was generated by using the online tools provided by CIMminer (http://discover.nci.nih.gov/cimminer/home.do)

