Figure 7.
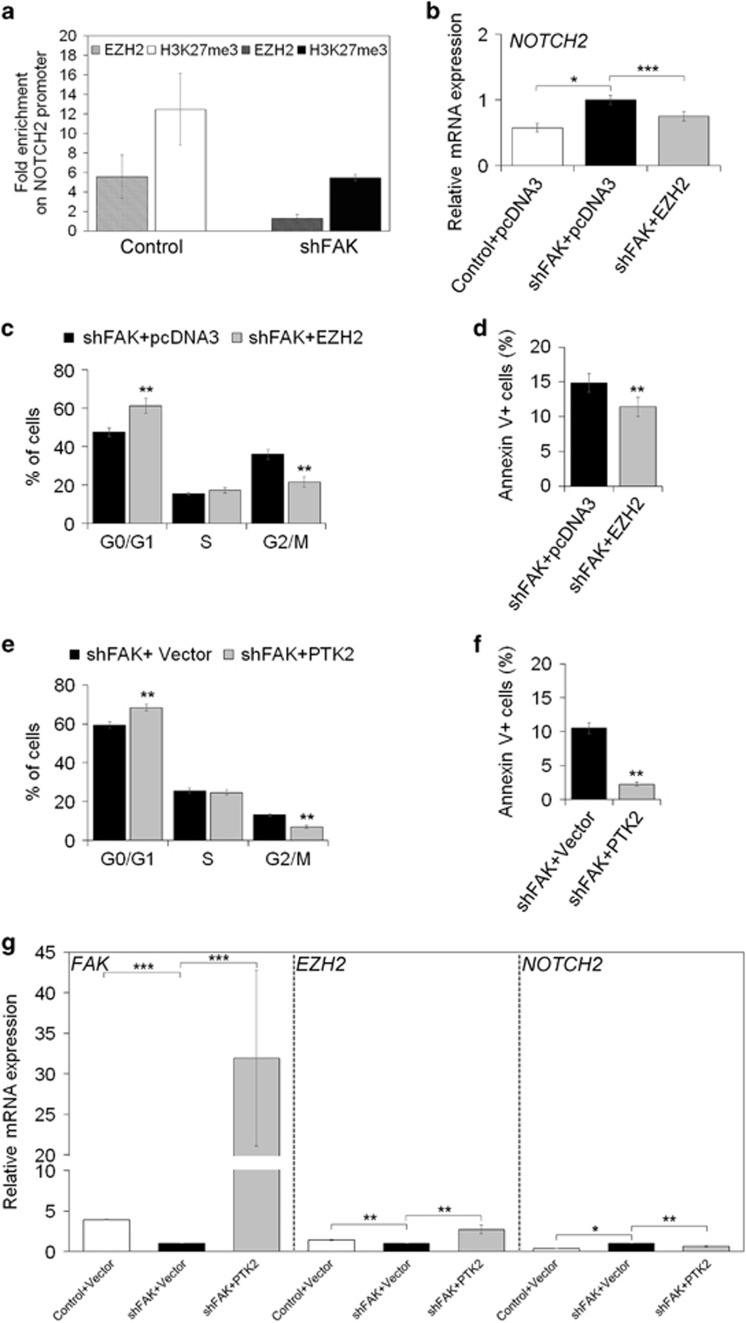
FAK silencing affects EZH2 dependent repression of NOTCH2 transcription. (a) ChIP assays for EZH2 and H3K27me3 at the NOTCH2 promoter in Control and shFAK HepG2 cells. Data are expressed as fold enrichment of three independent experiments repeated in duplicate. (b) Relative mRNA expression of NOTCH2 gene as measured by qRT-PCR in Control+pcDNA3, shFAK+pcDNA3 and shFAK+EZH2 HepG2 after 72 h from plasmid transfection. Values are expressed as fold mean±SD of three independent experiments repeated in triplicate (*P<0.05; ***P<0.001). (c) Distribution of shFAK+pcDNA3 and shFAK+EZH2 HepG2 in G0/G1, S, G2/M and SubG1 phase of the cell cycle by PI staining and flow cytometric analysis. Values are plotted as mean±SD (**P<0.01; n=3). (d) Percentage of apoptotic shFAK+pcDNA3 versus shFAK+EZH2 HepG2 cells measured by Annexin V and flow cytometry. Values are plotted as mean±SD (**P< 0.01; n =5). (e) Distribution of shFAK+Vector and shFAK+PTK2 HepG2 in G0/G1, S, G2/M and SubG1 phase of the cell cycle by PI staining and flow cytometric analysis. Values are plotted as mean±SD (**P<0.01; n=3). (f) Percentage of apoptotic of shFAK+Vector and shFAK+PTK2 HepG2 cells measured by Annexin V and flow cytometry. Values are plotted as mean±SD (**P< 0.01; n=3). (g) Relative mRNA expression of FAK, EZH2 and NOTCH2 genes as measured by qRT-PCR after 48 h from plasmid transfection (empty or PTK2 vector) in Control and shFAK HepG2 cells (**P<0.01; *P<0.05; n=3)

