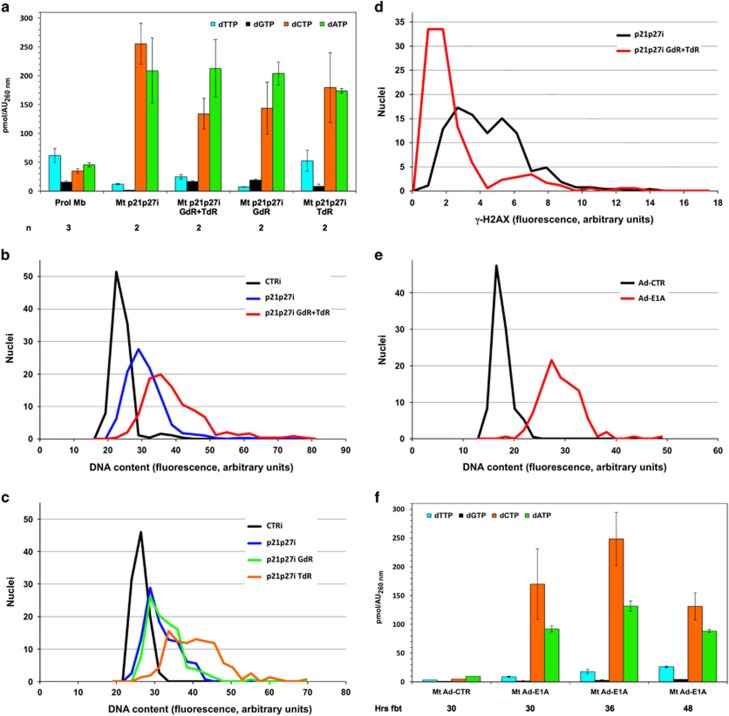
Figure 2.
Higher dTTP and dGTP levels allow extended DNA replication in reactivated myotubes. (a) Myotubes reactivated by p21 and p27 RNAi as in Figure 1. GdR (500 μM) and/or TdR (100 μM) were added to the culture medium 17 h later. The dNTP pool was quantitated as in panel (a) 30 h from the beginning of treatment (fbt); data from 2–4 independent experiments and statistical evaluations are shown in Supplementary Table S2. Values for proliferating myoblasts and myotubes reactivated by p21 and p27 RNAi (30 h fbt) are the same shown in Figure 1 and are reproduced here for ease of reference. (b and c) Myotubes were transfected as in panel (a); 30 h fbt, at the end of S phase, the cells were immunostained for MCM7, a marker of cell cycle reactivation, and counterstained with DAPI. Nuclear DNA content was evaluated by microfluorimetric measurement of DAPI fluorescence in individual MCM7+ myotube nuclei. On average, 209 nuclei per sample were evaluated (range 112–285) and their DNA content distribution is shown by the corresponding curve. Nuclei belonging to control, resting myotubes were uniformly MCM7− and their DNA content was determined without selection. The graphs refer to 1 representative experiment out of 2–4; Supplementary Table S3 summarizes all the results. (d) Myotubes, treated as indicated, were subjected, 30 h fbt, to immunofluorescence for γ-H2AX and Ki67, a marker of cell cycle reactivation. γ-H2AX staining intensities were measured in Ki67-positive nuclei by microfluorimetry. Control myotubes displayed no detectable γ-H2AX fluorescence and are not reported in the graph. (e) Myotubes were infected with an E1A-expressing adenovirus (Ad-E1A) or a control one (Ad-CTR). At the end of S phase, 39 h postinfection, microfluorimetric quantitation of DNA content was performed as in panel (b). The graph reports one out of the three experiments; Supplementary Table S3 summarizes all the results. (f) dNTP measurements in myotubes reactivated by E1A or infected with Ad-CTR. The myotubes were harvested at the indicated times

