
Figure 2.
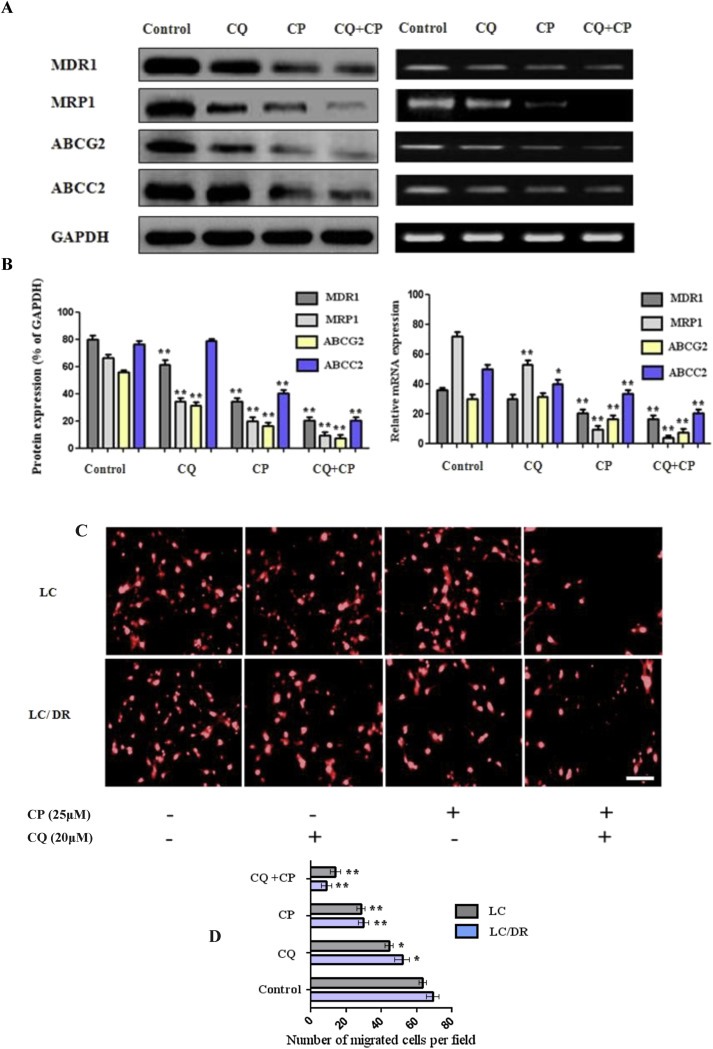
Co‐treatment of chloroquine and carboplatin inhibits cellular migration and downregulates expression of drug resistance genes. (A–B) The protein and mRNA expression levels of MDR1, MRP1, ABCG2 and ABCC2 were assayed by western blot and RT‐PCR, respectively. LC/LC‐DR cells were treated with autophagy inhibitor chloroquine (20 μΜ) or carboplatin (25 μΜ) for 24 h. (C–D) Effect of chloroquine or carboplatin on cell migration using transwell migration assay. Ex vivo cultured cells treated for 24 h with autophagy inhibitor chloroquine (20 μΜ) or carboplatin (25 μΜ) and subjected to migration assay to determine cellular migration (magnification ×200) (Scale bar, 10 μm). Data represent the mean ± SD of three independent experiments. (*P < 0.05; **P < 0.01). GAPDH was used as a loading control for western blot analysis. Densitometric analysis of each protein level was calculated from the average of three experiments. Each value was expressed as the ratio of the measured protein to GAPDH level (p < 0.001). For the RT‐PCR GAPDH was used as an internal control in the mRNA analysis experiments.