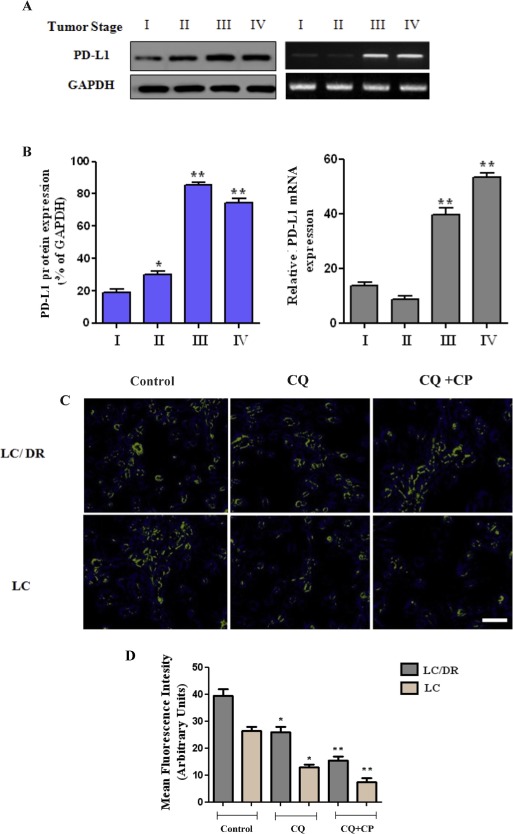
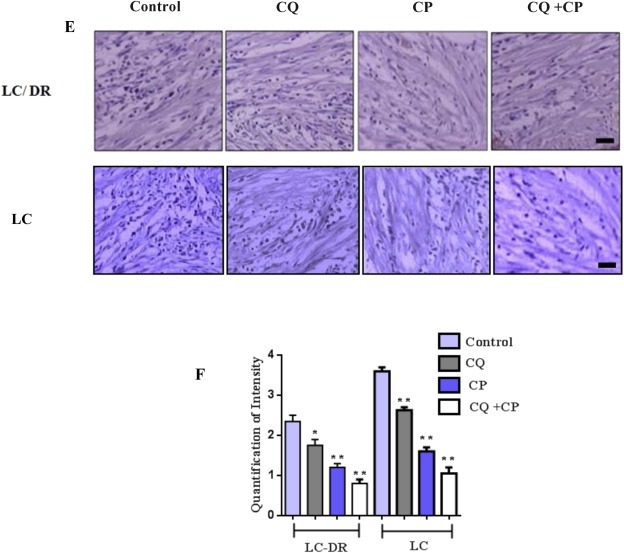
Figure 4.
Autophagy inhibition on PD‐L1 expression and clinicopathological correlation with tumor progression. (A–B) The protein and mRNA expression level of PD‐L1 was assayed by western blot and RT‐PCR, respectively. (C–D) LC/LC‐DR cells were treated with autophagy inhibitor chloroquine (20 μΜ) or carboplatin (25 μΜ) for 24 h and PD‐L1 expression was measured by immunofluorescence analysis (magnification ×200). (F–G) Immunohistochemical analysis was performed in lung biopsies following chloroquine and carboplatin treatment (50 μΜ) for 1 h using mouse IgG1 isotype as negative control. Images were obtained through a Carl Zeiss microscope using image analysis software (Scale bar, 50 μm) (magnification ×400). (D) Quantification of immunohistochemistry by the intensity of the positive immunosignals in the tissue sections are showed in histograms (*P < 0.05, **P < 0.01). Stained tumor cells are shown at a final magnification (×200). Data represent the mean ± SD of three independent experiments. (*P < 0.05; **P < 0.01).