
Figure 5.
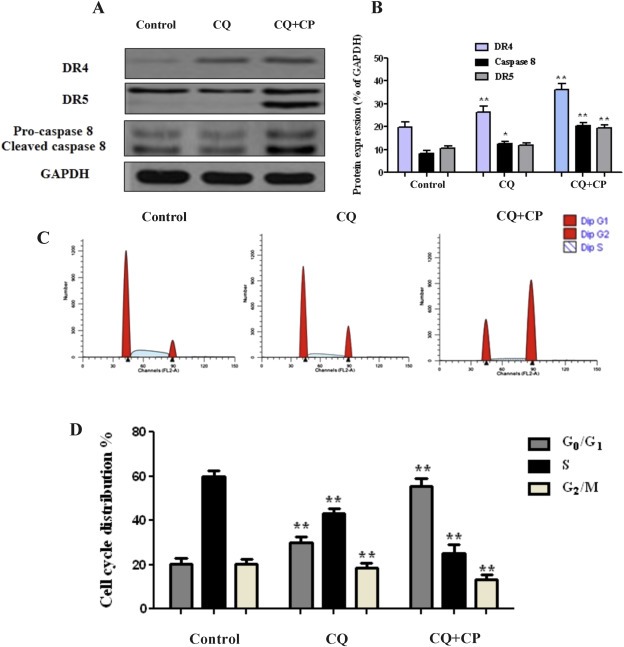
Autophagy inhibition activates carboplatin related TRAIL apoptosis. (A–B) LC‐DR cells were treated with autophagy inhibitor chloroquine (20 μΜ) or carboplatin (25 μΜ) for 24 h. Protein levels of DR4, DR5 and caspase 8 were analyzed by western blot. Ex vivo lung cultured cells were treated with chloroquine (20 μΜ) and carboplatin (25 μΜ) for 24 h and subjected to FACS analysis. Data represent the mean ± SD of three independent experiments (*P < 0.05, **P < 0.01). (C–D) Co‐treatment of chloroquine‐carboplatin induces cell cycle G0/G1 arrest in lung cancer cells. Ex vivo lung cultures were treated with chloroquine (20 μΜ) and carboplatin (25 μΜ). After 24 h, cells were collected and subjected to flow cytometric analysis of cell cycle distribution. Data show the representative of three independent experiments (*P < 0.05, **P < 0.01). GAPDH was used as a loading control for western blot analysis. Densitometric analysis of each protein level was calculated from the average of three experiments. Data represent the mean ± SD of three separate experiments. (*P < 0.05; **P < 0.01).