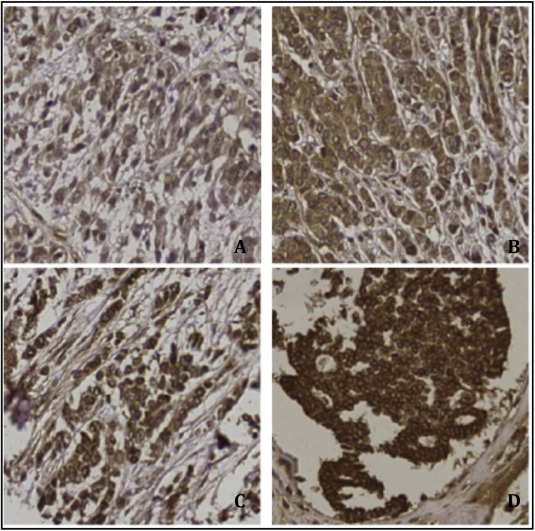
Figure 1.

20× pictures of immunohistochemical IGF‐1R staining showing: A – no staining at all or membrane staining in <10% of the tumor cells (0). B – faint/barely perceptible partial membrane staining in >10% of the tumor cells (1+). C – weak to moderate complete membrane staining in >10% of the tumor cells (2+). D – strong to complete membrane staining in >10% of the tumor cells (3+).
