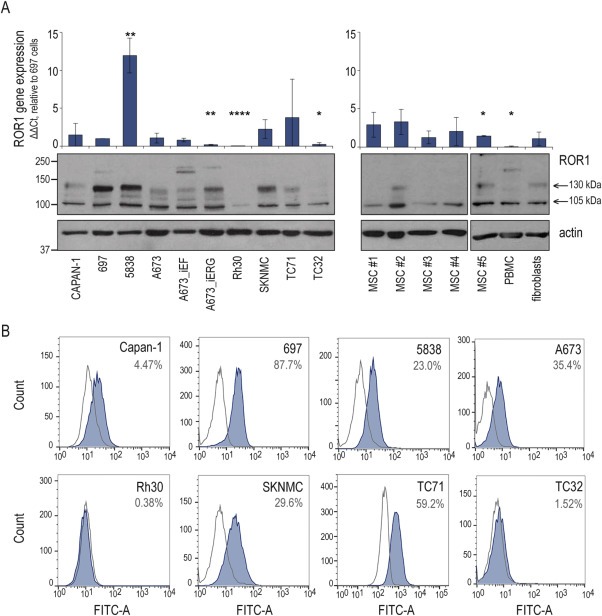
Figure 5.

ROR1 expression in Ewing sarcoma (A) Upper panels: ROR1 gene expression. qPCR DDCt‐method relative to GAPDH and to 697 ALL positive control cells. Graphs and error bars show mean and standard deviation of at least three independent experiments. Significance: **** p<0.0001, *** p<0.001, ** p<0.01, * p<0.05. Lower panels: Western blot of ROR1 protein expression, actin as loading control. (B) FACS analysis of ROR1 cell surface expression (blue graph) and IgG control (open curve). Percentages are ROR1 positive cells. Representative of three experiments.
