Figure 3.

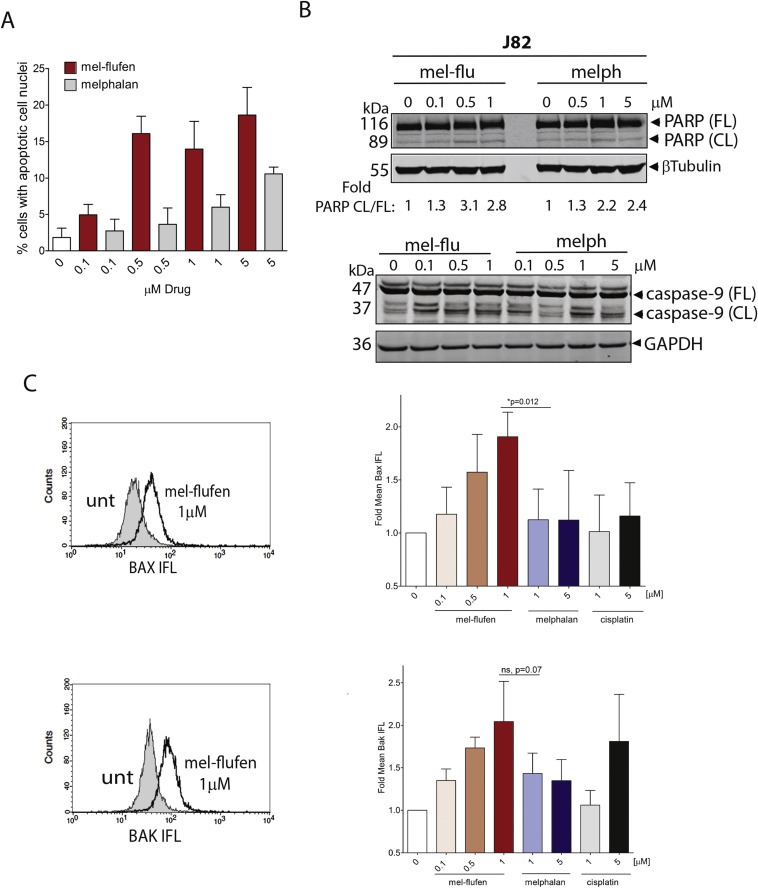
Mel‐flufen induces apoptosis in UC cell lines. (A) J82 cells were treated with mel‐flufen (red bars) or melphalan (grey bars) for 1 h and post incubated for 48 h. The nuclear morphology of the cells was assessed by DAPI‐staining and subsequent visualization in the FL‐1 channel of a Fluorescence microscope. The percentage of cells showing apoptotic nuclear morphology of 200 cells examined is given. Results shown are the mean ± SD from three biological replicates. Statistical difference between mel‐flufen and melphalan were reached at doses 0.5 μM, 1 μM and 5 μM (P = 0.0009, P = 0.0087 and P = 0.002 respectively). (B) Apoptosis was confirmed in J82 cells by analysing PARP‐1 and caspase‐9 cleavage by western blot treated as in (A) β‐tubulin and GAPDH was used as loading control for PARP‐1 and caspase‐9 analyses respectively. For PARP, the fold ratio CL/FL was determined by densitometry and is presented. (C) Bak or Bax activation in J82 cells was analysed by flow cytometry after 1 h treatment with mel‐flufen or melphalan, or after 24 h with cisplatin. Left: histogram showing Bak or Bax activation as a shift to the right in the diagram. Filled: untreated; unfilled: mel‐flufen treated. Right: Fold Bax or Bak mean IFL is presented relative to untreated cells. Data shown are the mean ± SD from three biological replicates. Upper panel: Bax, t‐test mel‐flufen 1 μM vs. melphalan 1 μM P = 0.012. Lower panel: Bak, t‐test mel‐flufen 1 μM vs. melphalan 1 μM P = 0.07.
