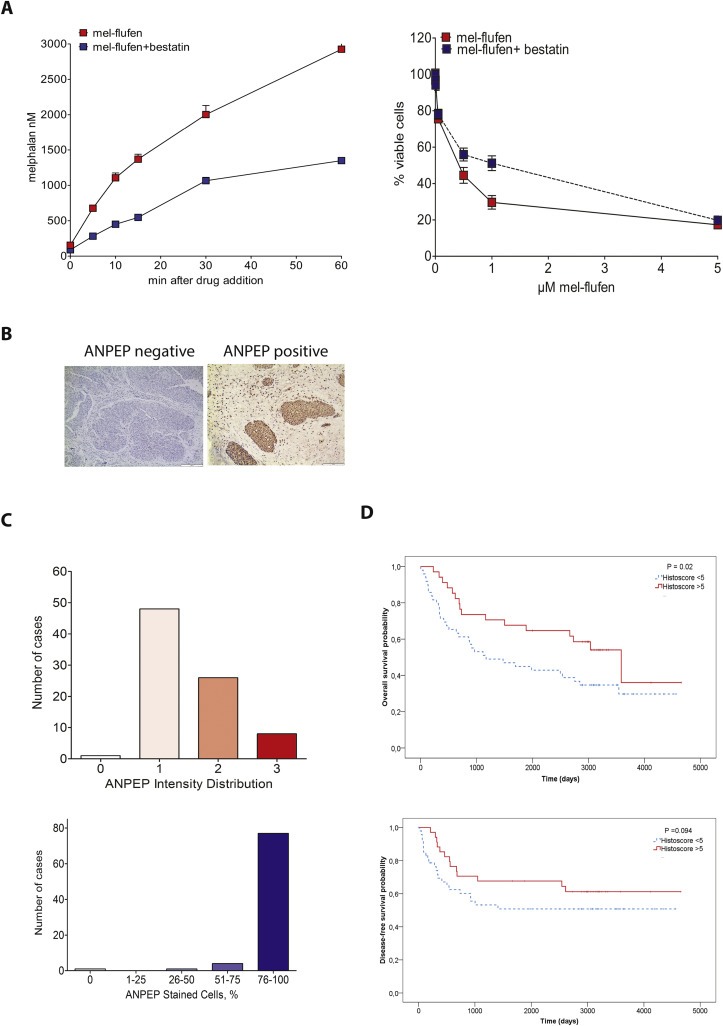
Figure 6.

Mel‐flufen intracellular loading and cell death is controlled by aminopeptidases and Aminopeptidase N display increased expression in clinical UC specimens. (A) Left: J82 cells were treated with 1 μM mel‐flufen alone or in combination with 5 μM bestatin. The concentrations of melphalan were measured using HPLC‐MS/MS. Data shown is the mean of three biological replicates. Right: Mel‐flufen‐induced cytotoxicity ± bestatin (5 μM) was analysed in J82 cells at 72 h after 1 h pulse treatment with indicated doses of mel‐flufen using MTT‐assay. Data shown are the mean ± SD of three biological replicates. (B) Immunohistochemical staining of ANPEP in primary urothelial carcinoma. Micrographs of UC specimens determined as negative or positive for ANPEP staining. Scale bar = 200 and 100 μm, respectively. (C) Distribution of immunohistochemistry ANPEP staining intensity (upper) and semi‐quantitative scoring of number of positive cells (lower) in UC specimen from 83 patients. (D) ANPEP expression in relation to overall survival (top) and disease‐free survival (bottom) by Kaplan–Meier method. Days from cystectomy is stated. ANPEP expression was stratified as high (Histoscore > 5, red solid line) or low (Histoscore < 5, blue dotted line). High tumour expression was significantly associated with better OS (P = 0.02, upper panel), but not significant for DFS (P = 0.094, lower panel).
