Figure 3.

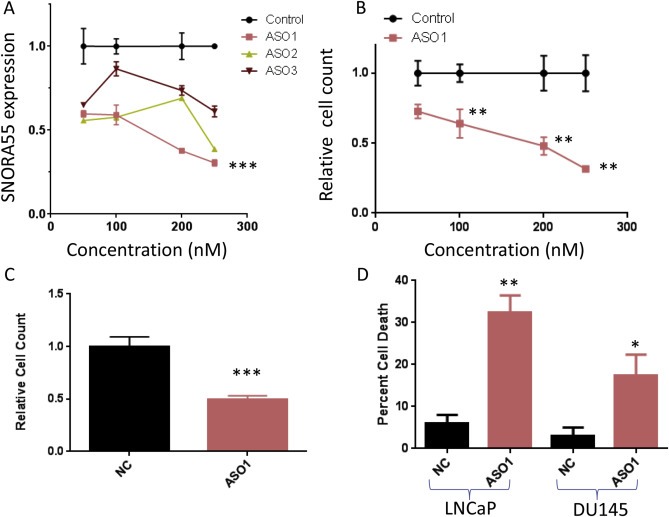
A, SNORA55 expression in LNCaP cells exposed to different ASO concentrations (48 h). ***p < 0.001 vs. control (1 way ANOVA and Tukey multiple comparison post‐test, highest concentration of each treatment). B, Relative LNCaP cell count after treatment with different ASO concentrations (48 h). **p < 0.01 (2 way ANOVA and Sidak post‐test). C, Relative DU145 cell count after treatment with ASOs (250 nM, 48 h). ***p < 0.001 (unpaired T test). D, Percentage of cell death in LNCaP and DU145 cells exposed to NC or ASO1 (250 nM, 48 h). *p < 0.05; **p < 0.01 (unpaired T test).
