
Figure 2.
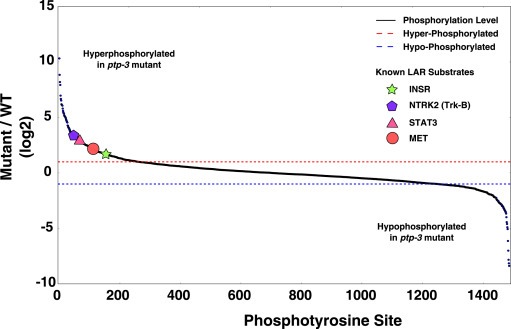
Distribution of phosphotyrosine sites identified. The relative change in phosphorylation levels of phosphotyrosine sites between the ptp‐3 mutant and wild type is shown. Higher values on the y‐axis correspond to increases in phosphotyrosine levels with a tyrosine phosphatase mutation. The red dashed line indicates a 2‐fold increase in tyrosine phosphorylation, and the blue dashed line indicates a 2‐fold decrease in tyrosine phosphorylation. Shapes with their corresponding gene are known substrates of human homologs of ptp‐3, and show that this study identifies known phosphotyrosine substrates as being hyperphosphorylated.