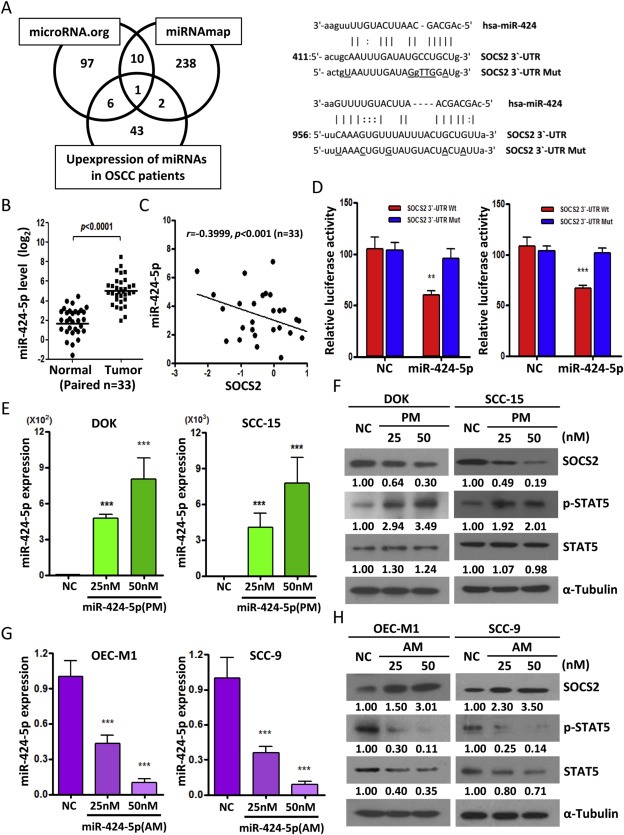
Figure 3.

SOCS2 is a direct target of miR‐424‐5p. A: Left, Venn diagram of predicted miRNA which targets SOCS2 3′‐UTR in silico using two independent algorithms (microRNA.org and miRNAmap) combined with our patients' miRNA array data (GSE45238). Right, Schematic representation of the putative miR‐424‐5p binding sequence in the 3′‐UTR of SOCS2 with wild‐type form (SOCS2 3′‐UTR Wt) and mutant form (SOCS2 3′‐UTR Mut). The mutated nucleotides are labeled with underline. B: qRT‐PCR analysis to validate the miR‐424‐5p expression pattern in tumors versus their normal adjacent tissues for another OSCC cohort samples (n = 33). C: Correlation analysis of miR‐424‐5p and SOCS2 in human OSCC patients (n = 33) by qRT‐PCR analysis. D: The effect of miR‐424‐5p mimics (PM, 25 nM) on the luciferase activities of the constructs containing the wild‐type or mutant‐type 3′‐UTR in DOK (left) and SCC‐15 (right) cells. The relative luciferase activity of each sample is measured at 48 h after transfection and normalized to Renilla luciferase activity. E: qRT–PCR analysis showing the expression level of miR‐424‐5p in DOK and SCC‐15 cell lines after transfection with 25 nM or 50 nM of miR‐424‐5p mimics (PM) for 48 h. F: Western blot analysis of the SOCS2, STAT5 and phosphor‐STAT5 after transfection of miR‐424‐5p mimics (PM) with 25 nM or 50 nM for 48 h in DOK and SCC‐15 cells. G: qRT–PCR analysis showing the expression level of miR‐424‐5p in OEC‐M1 and SCC‐9 cells after transfection with indicated concentration of miR‐424‐5p inhibitors (AM) for 48 h. H: Western blot analysis of the SOCS2, STAT5 and phosphor‐STAT5 after transfection of miR‐424‐5p inhibitors (AM) with indicated concentration for 48 h OEC‐M1 and SCC‐9 cells. All data are presented as mean ± SE; **, p < 0.01; ***, p < 0.001 versus scramble control (NC). α‐Tubulin was used as protein loading control. Numerical values for protein band intensities are shown below the gels. The values were quantitated by densitometry and normalized to α‐tubulin.
