Figure 5.

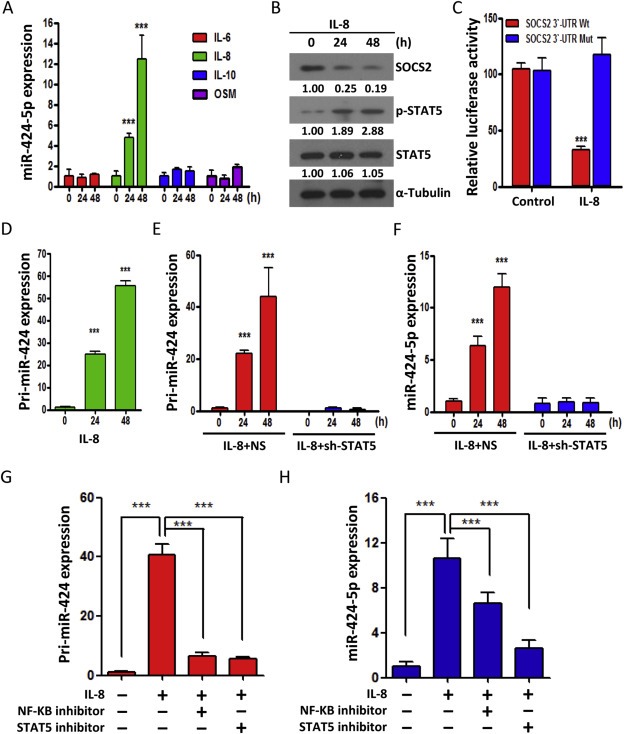
miR‐424‐5p disrupts IL‐8/STAT5/SOCS2 feedback loop. A: qRT–PCR analysis showing the expression level of miR‐424‐5p in SCC‐15 cells treated with various cytokines, including IL‐6, IL‐8, IL‐10 and OSM (each for 10 ng/ml) for indicated time periods. B: Western blot analysis of the SOCS2, STAT5 and phosphor‐STAT5 in SCC‐15 cells after addition of IL‐8 (10 ng/ml) for 24 and 48 h. The numerical values for protein band intensities were corrected with the values for the loading control α‐Tubulin bands. C: The effect of IL‐8 (10 ng/ml) on the luciferase activities of the constructs containing the wild‐type or mutant‐type SOCS2 3′‐UTR in SCC‐15 cells. The relative luciferase activity of each sample is measured at 48 h after transfection and normalized to Renilla luciferase activity. D: qRT–PCR analysis of primary miR‐424 (pri‐miR‐424) expression in SCC‐15 cells treated with IL‐8 (10 ng/ml). E–F: qRT–PCR analysis of primary miR‐424 (pri‐miR‐424) (E) and mature miR‐424 (miR‐424‐5p) (F) in SCC‐15 cells transfected with control (NS) or STAT5 shRNAs for 24 h and subsequently treated with IL‐8 for 24 or 48 h. G–H: qRT–PCR analysis of primary miR‐424 (pri‐miR‐424) (G) and mature miR‐424 (miR‐424‐5p) (H) in SCC‐15 cells treated with NF‐kB inhibitor or STAT inhibitor for 16 h and subsequently treated with IL‐8 (10 ng/ml) for 48 h. All data are presented as mean ± SE; ***, p < 0.001, one‐way ANOVA p < 0.0001.
