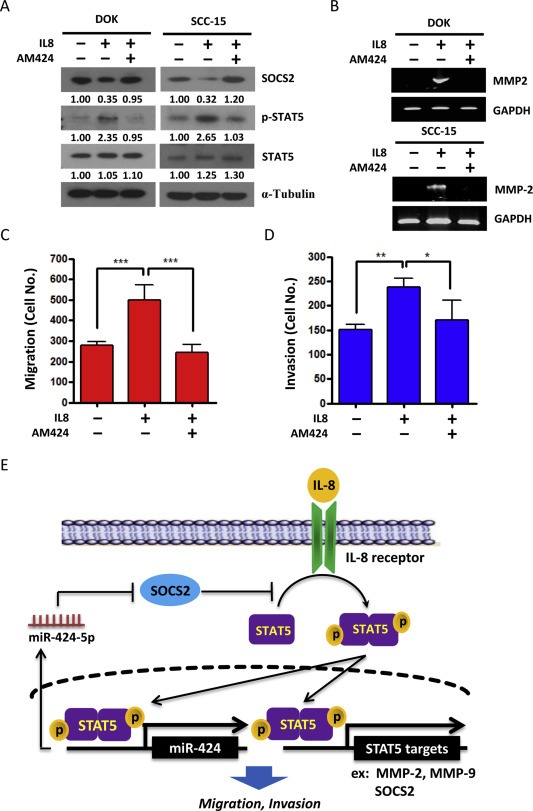
Figure 6.

IL‐8 induces invasion and migration of OSCC cells through induction of miR‐424‐5p. DOK and SCC‐15 cells were transfected with miR‐424‐5p specific inhibitors (AM424) for 24 h, followed by addition of IL‐8 (10 ng/ml) for 48 h. A: Western blot analysis of the SOCS2, STAT5 and phosphor‐STAT5. α‐Tubulin was used as protein loading control. The numerical values for protein band intensities were corrected with the values for the loading control α‐tubulin bands. B: RT‐PCR analysis of MMP‐2 expression. GAPDH was used as an internal control. C: Migration assay using Boyden Chamber system. The data are represented as mean ± SE; ***, p < 0.001 versus vector control, one‐way ANOVA p = 0.0067. D: Invasion assay using Boyden Chamber system. The data are presented as mean ± SE; *, p < 0.05; **, p < 0.01; one‐way ANOVA p = 0.0022. E: Schematic representation of the proposed hypothesis that miR‐424‐5p disrupts IL‐8/STAT5/SOCS2 feedback loop in OSCC model.
