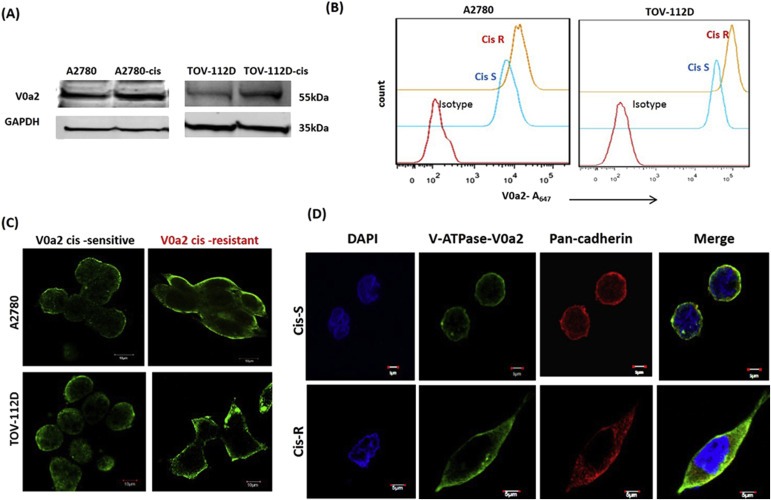
Figure 2.

Cisplatin resistant ovarian carcinoma cells exhibit over‐expressed V‐ATPase‐V0a2 on the tumor cell surface. (A) Total protein from cisplatin resistant ovarian tumor cells and respective sensitive phenotypes were immuno‐blotted with anti‐V‐ATPase‐V0a2 antibody that showed V0a2 over expression in cisplatin resistant cells. (B) The surface expression of V‐ATPase‐V0a2 was also elevated in non‐permeabilized cis‐R (cis‐A2780/cis‐TOV112D; orange line) compared to cis‐S (A2780/TOV112D; blue line) as determined by fluorescence‐activated cell sorting (FACS). Red line indicates primary antibody isotype control. (C) Immuno‐fluorescence analysis showing elevated V‐ATPase‐V0a2 expression on the plasma membrane of cisplatin resistant OVCA cell lines as shown by green staining. Magnification – ×600; scale bars; 10 μm (D) Confocal microscopy analysis of V‐ATPase‐V0a2 (in green) and cells surface marker, pan cadherin (in red) in cisplatin sensitive ovarian cancer cells (Cis‐S) and cisplatin resistant ovarian cancer cells (Cis‐R). Merged images (yellow regions) reveal the co‐localization of V‐ATPase‐V0a2 with pan cadherin which is more pronounced in resistant cells. Original magnification – ×600; scale bars; 5 μm. Representative images from three independent experiments are shown.
