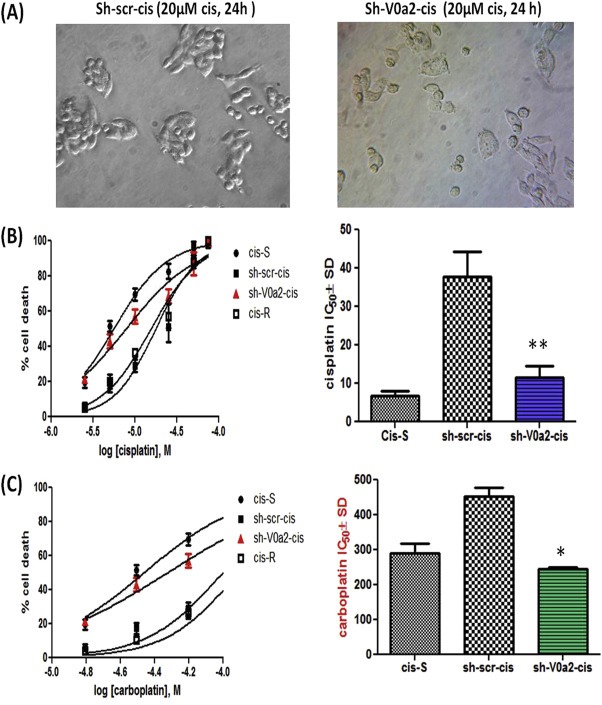
Figure 5.

Inhibition of V‐ATPase‐V0a2 sensitizes the cisplatin resistant cells to platinum drugs. (A) Phase contrast images showing the cell morphology of control cis‐A2780 (sh‐scr‐cis) and V‐ATPase‐V0a2 knockdown cells (sh‐V0a2‐cis) upon treatment with cisplatin (20 μM, 24 h). (B) Dose–response curve of sh‐scr‐cis, sh‐V0a2‐cis, cisplatin resistant (cis‐R) and cisplatin sensitive cells (cis S) following 48 h treatment with cisplatin. The IC50 values are depicted in histograms in the right panel.(C) Dose response curves of cis‐S, sh‐scr‐cis, sh‐V0a2‐cis and cis‐R following 48 h treatment with carboplatin. The IC50 values are depicted in histograms in the right panel. Values are means (±S.D) of two independent experiments performed in triplicate. Compared with control **P < 0.01, *P < 0.05 (Mann–Whitney test).
