Figure 2.

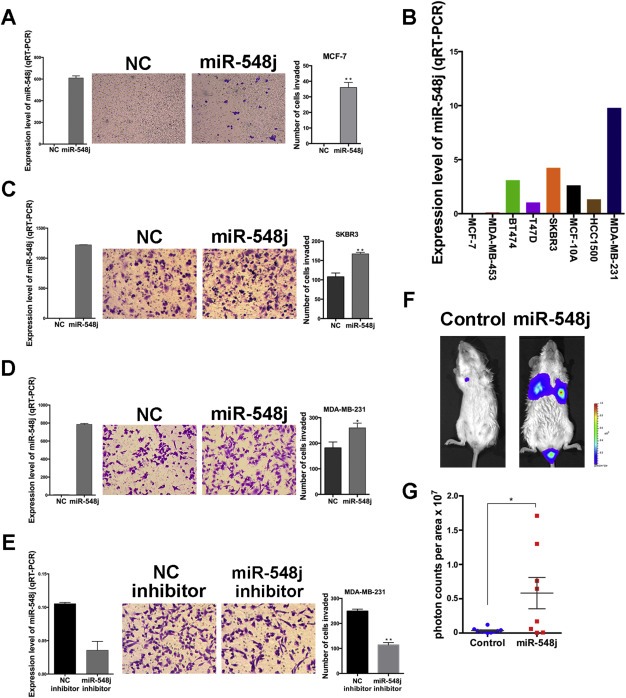
miR‐548j promotes breast cancer cell invasion in vitro and in vivo. (A) Expression level of miR‐548j (left), representative micrographs (middle) and quantification of invading cells (right) of MCF‐7 cells transfected with NC or miR‐548j mimics. (B) The endogenous expression level of miR‐548j in some breast cancer cell lines as determined by quantitative RT‐PCR. The values were normalized to U6. (C–D) Expression level of miR‐548j (left), representative micrographs (middle) and quantification of invading cells (right) of SKBR3 (C) and MDA‐MB‐231 (D) transfected with NC or miR‐548j mimics. (E) Expression level of miR‐548j (left), representative micrographs (middle) and quantification of invading cells (right) in MDA‐MB‐231 cells transfected with NC inhibitor or miR‐548j inhibitor. (F) Representative photos of bioluminescence of mice from each group injected with the indicated cells. The metastasis animal model was carried out as described in the Materials and Methods. (G) Quantitative analysis of metastasis. The values of bioluminescence signals from each group were quantified and expressed as photon counts per area. P‐values were obtained using the Mann–Whitney U‐test. Error bars in this figure represent mean ± SEM. *P < 0.05, **P < 0.01.
