Figure 2.

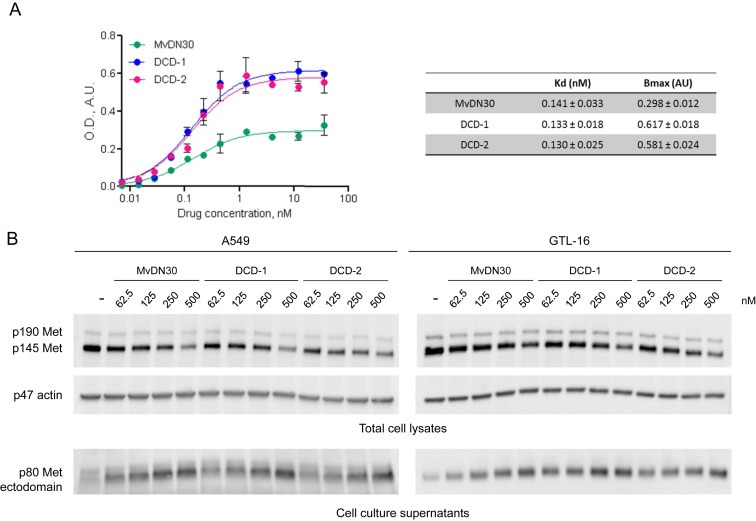
DCDs maintain high binding affinity to Met and efficient induction of receptor shedding. A. ELISA binding analysis of Met‐Fc chimera (solid phase) to the different DN30‐derived molecules (liquid phase). O.D.: Optical Density at 450 nm; A.U.: Arbitrary Unit. Each point is the mean of triplicate values. Bars represent SEM. Values of Affinity (Kd) and Maximal Binding (Bmax) are reported in the table. B. A549 (left panels) or GTL‐16 (right panels) cells were incubated with increasing concentrations of the indicated molecules for 48 h (A549) or 18 h (GTL‐16). Total Met levels in the cell lysates (upper panels) and in the cell culture supernatants (lower panels) were determined by Western blot using anti‐Met antibodies directed against epitopes located respectively at the c‐terminal tail or within the extracellular domain of the β chain. To normalize protein loading, the same filter was re‐probed with anti‐actin antibodies. p190 Met: unprocessed Met receptor; p145 Met: Met receptor β chain; p80 Met: Met extracellular domain. p47 actin: actin. Data reported in the figure are representative of at least three experiments done.
